GBP/JPY Price Forecast: 217.00 caps bulls as RSI stalls
- GBP/JPY holds near 217.00 as horizontal price action persists.
- RSI remains bullish, but stalls near the 60 reading.
- Break below 216.00 exposes 215.68 and 215.00 supports.

The GBP/JPY consolidates near familiar levels around 217.00 on Monday, as risk aversion dominates markets, with flows moving into haven assets like the US Dollar and Gold amid uncertainty over the Middle East conflict.
GBP/JPY Price Forecast: Technical Outlook
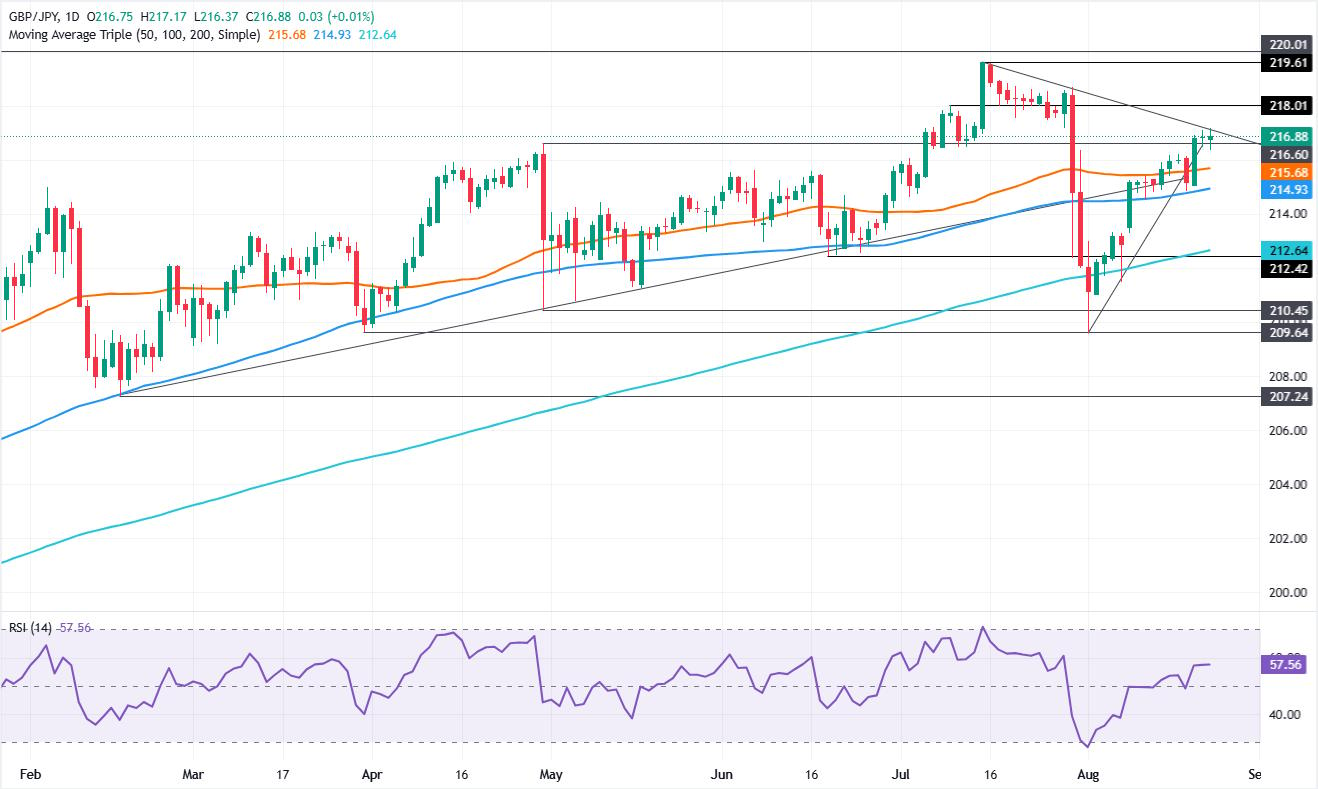
Price action remains horizontal, while momentum has shifted bullish, as depicted by the Relative Strength Index (RSI): After bouncing at the 50-neutral level, the RSI aimed higher but stalled at the 60 reading over the last two days.
For a bullish continuation, the GBP/JPY must clear 217.00. Once surpassed, the next stop would be a downslope resistance trendline at around the 217.20-30 range, followed by the 218.00 mark and the July 30 high at 218.69. Above the next stop would be 219.00.
On the downside, the first support for GBP/JPY would be the 216.00 psychological level. Below the next stop is the 50-day Simple Moving Average (SMA) at 215.68, followed by 215.00. A decisive push by the bears, opens the door to challenge the 100-day SMA at 214.93.
GBP/JPY Price Chart – Daily
Japanese Yen Price Today
The table below shows the percentage change of Japanese Yen (JPY) against listed major currencies today. Japanese Yen was the strongest against the Canadian Dollar.
| USD | EUR | GBP | JPY | CAD | AUD | NZD | CHF | |
|---|---|---|---|---|---|---|---|---|
| USD | 0.13% | 0.09% | 0.06% | 0.59% | 0.30% | 0.27% | 0.16% | |
| EUR | -0.13% | -0.01% | -0.02% | 0.49% | 0.20% | 0.22% | 0.05% | |
| GBP | -0.09% | 0.00% | 0.00% | 0.51% | 0.21% | 0.23% | 0.05% | |
| JPY | -0.06% | 0.02% | 0.00% | 0.56% | 0.15% | 0.21% | 0.05% | |
| CAD | -0.59% | -0.49% | -0.51% | -0.56% | -0.37% | -0.24% | -0.44% | |
| AUD | -0.30% | -0.20% | -0.21% | -0.15% | 0.37% | 0.03% | -0.14% | |
| NZD | -0.27% | -0.22% | -0.23% | -0.21% | 0.24% | -0.03% | -0.19% | |
| CHF | -0.16% | -0.05% | -0.05% | -0.05% | 0.44% | 0.14% | 0.19% |
The heat map shows percentage changes of major currencies against each other. The base currency is picked from the left column, while the quote currency is picked from the top row. For example, if you pick the Japanese Yen from the left column and move along the horizontal line to the US Dollar, the percentage change displayed in the box will represent JPY (base)/USD (quote).
Author

Christian Borjon Valencia
FXStreet
Markets analyst, news editor, and trading instructor with over 14 years of experience across FX, commodities, US equity indices, and global macro markets.

















