|

FTSE Elliott Wave: Forecasting the rally after a three-wave pullback

In this technical article we’re going to take a quick look at the Elliott Wave charts of FTSE Index published in members area of the website.

As our members know, FTSE  made a pullback that unfolded as an Elliott Wave Zig Zag pattern. Price completed a clear 3-wave move down from the peak and found support at the Equal Legs zone (buying area).

In the following analysis, we explain the Elliott Wave pattern and the market outlook.

FTSE Elliott Wave one-hour chart 06.22.2026

FTSE

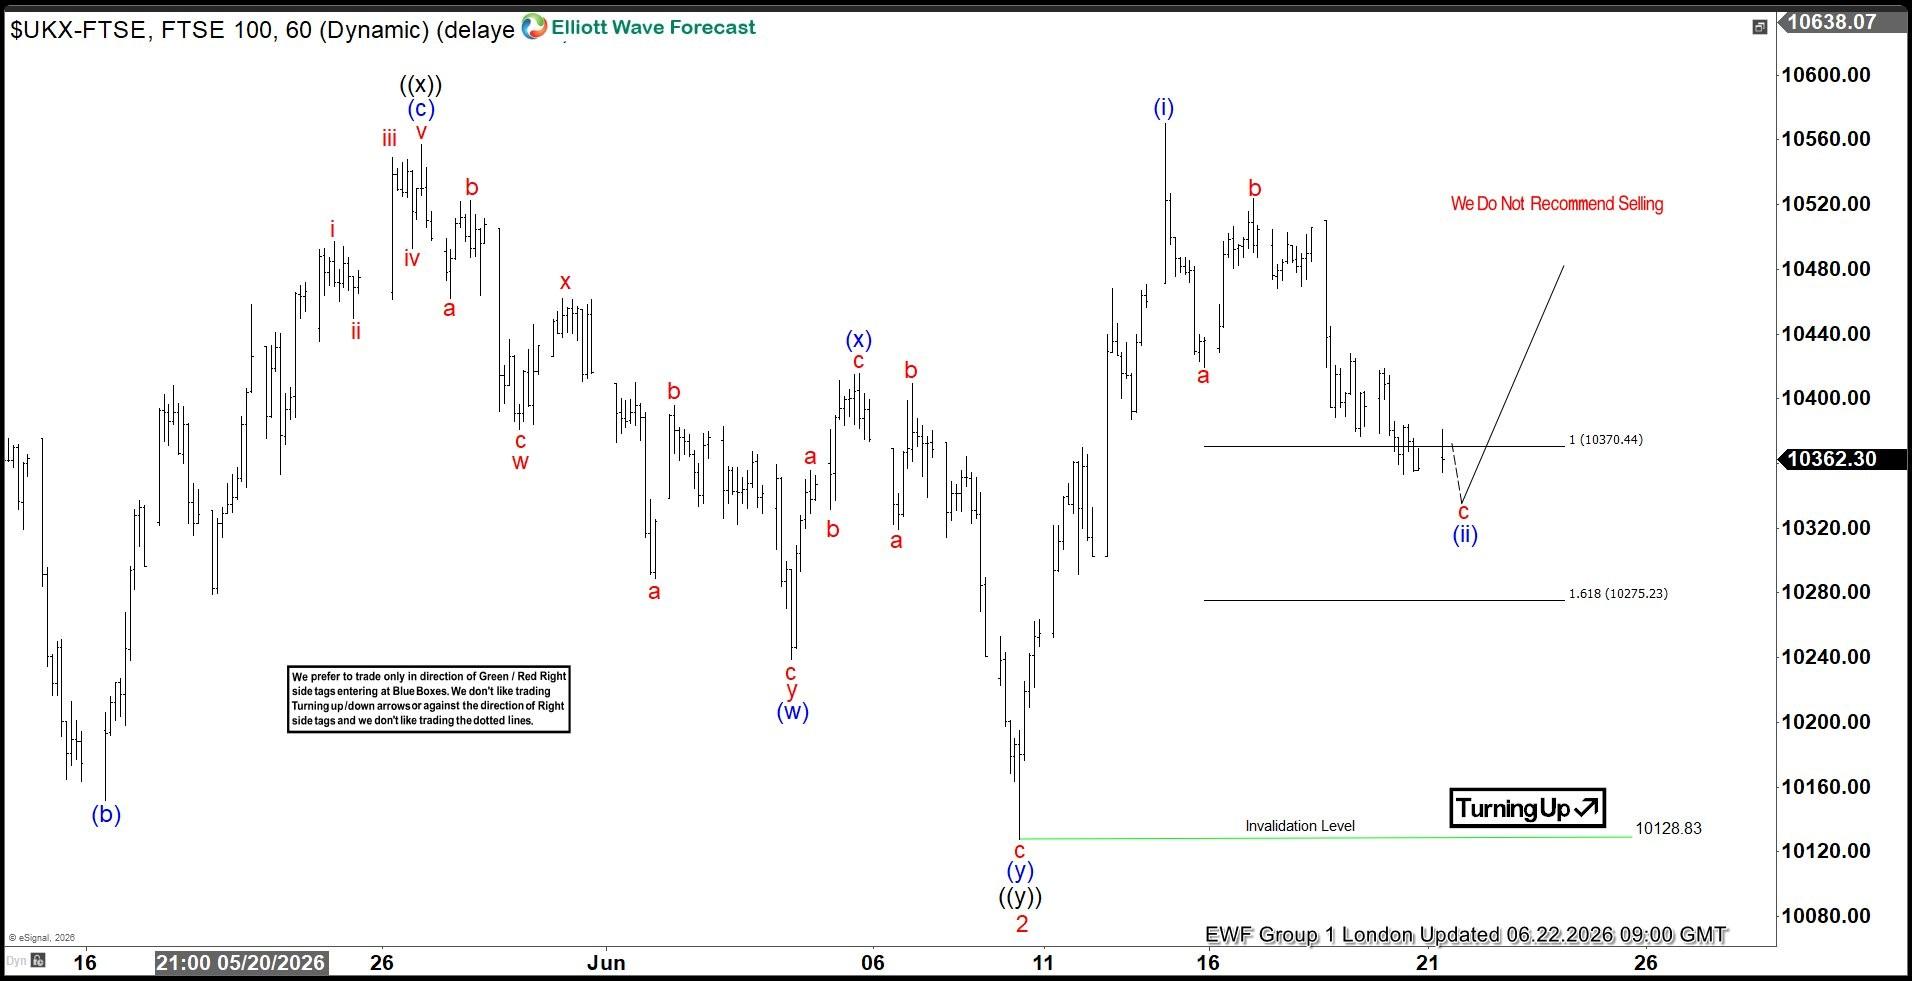
FTSE is currently forming an intraday three-wave pullback from recent highs. We identified a buying zone by measuring the Equal Legs area using the Fibonacci extension tool, with a projected relative to b. The ideal support area comes in at 10370.44-10275.23. The correction is not complete yet, and the index could see more downside in the near term within the marked buying zone. As long as price holds within this region, we expect buyers to step in and the rally to resume toward new highs.

FTSE Elliott Wave one-hour chart 07.03.2026

FTSE

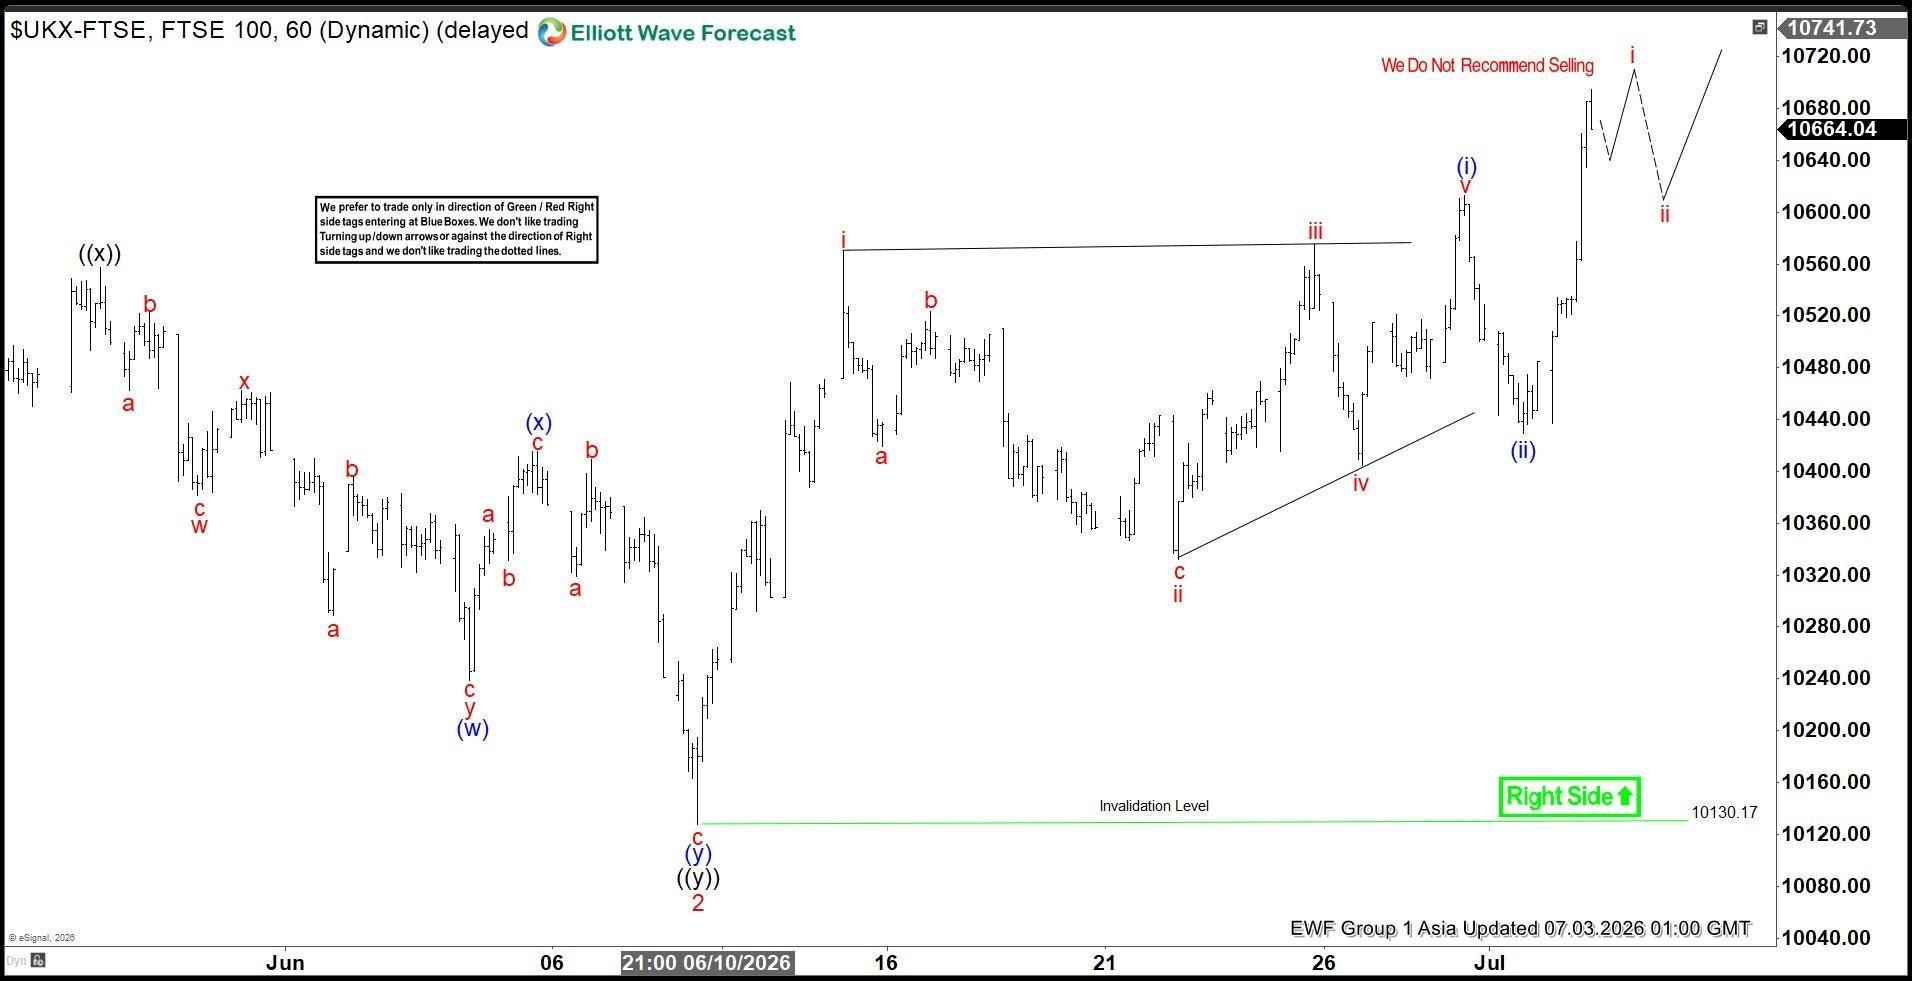
The Index has found buyers at the Equal Legs zone , just as expected. The correction ended at the 10333.17 low, and since then, FTSE is giving us a rally. As a result, any long positions from the equal legs zone are now risk-free.

Author

Elliott Wave Forecast Team

Elliott Wave Forecast Team

ElliottWave-Forecast.com

More from Elliott Wave Forecast Team
Share:

Editor's Picks

GBP/USD clings to daily gains near 1.3350

GBP/USD holds just in positive territory around 1.3350 on Friday as the Greenback keeps a vacillating price action. With Fed rate hike expectations easing and US markets closed for the Independence Day holiday, Cable remains on track to post solid weekly gains.

EUR/USD remains sidelined around 1.1440

EUR/USD holds on to its recent gains and consolidates around 1.1440 at the end of the week as the US Dollar lacks clear direction. In the meantime, trading conditions remain subdued, with volatility constrained by the closure of US markets for the Independence Day holiday.

Gold flirts with two-week highs, targets $4,200

Gold extends its recovery for a third straight day, advancing toward the $4,200 mark per troy ounce on Friday. The precious metal looks set to snap a four-week losing streak as softer-than-expected June US NFP data prompt investors to scale back expectations of further Fed tightening.

Crypto Today: Bitcoin, Ethereum, XRP advance amid renewed capital inflows

Bitcoin maintains its upward momentum, holding above the $61,000 mark at the time of writing on Friday. Major altcoins such as Ethereum and Ripple are also posting gains, signaling a modest uptick in market sentiment and renewed risk appetite among investors.

The Iran war failed to trigger a recession. Can the US economy keep defying expectations?

Nearly four months after the start of the Iran war, the US economy remains remarkably resilient. While the conflict initially triggered a severe disruption to global energy markets and a sharp rise in Oil prices, recent diplomatic progress between Washington and Tehran has eased concerns about a prolonged supply shock.

Kevin Warsh offers no policy clues: Why markets still got their answer

Financial markets came to Sintra looking for clues about the Federal Reserve's (Fed) next move. They largely left with confirmation that Fed Chair Kevin Warsh intends to make those clues much harder to find.