|

EUR/USD Technical Analysis: The pair stays supported around the 55-day SMA near 1.1380

  • EUR/USD stays under pressure around the 1.1400 handle so far today, coming down after testing fresh tops in the 1.1580/85 band, where sits the 61.8% Fibo retracement of the September-November drop.
  • Further consolidation thus appears likely in the short-term horizon as long as the 55-day SMA around 1.1380 holds the downside.
  • On the upside, the key 100-day SMA at 1.1470 emerges as the interim hurdle ahead of more relevant levels at/above 1.1500 the figure.

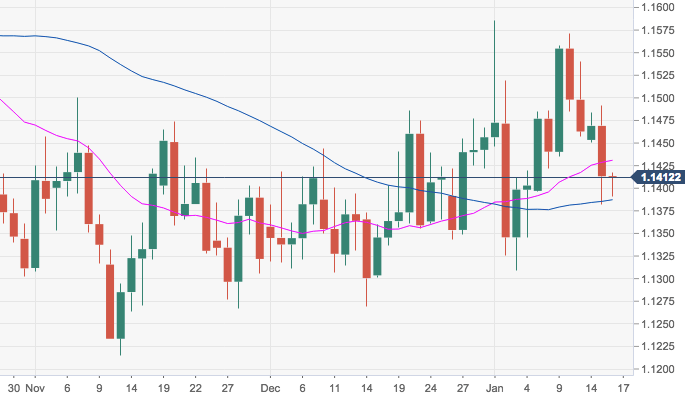
EUR/USD daily chart

EUR/USD

Overview:
    Today Last Price: 1.1416
    Today Daily change: 3.0 pips
    Today Daily change %: 0.0263%
    Today Daily Open: 1.1413
Trends:
    Previous Daily SMA20: 1.1432
    Previous Daily SMA50: 1.1385
    Previous Daily SMA100: 1.1471
    Previous Daily SMA200: 1.1619
Levels:
    Previous Daily High: 1.1491
    Previous Daily Low: 1.1382
    Previous Weekly High: 1.1571
    Previous Weekly Low: 1.1396
    Previous Monthly High: 1.1486
    Previous Monthly Low: 1.1269
    Previous Daily Fibonacci 38.2%: 1.1424
    Previous Daily Fibonacci 61.8%: 1.145
    Previous Daily Pivot Point S1: 1.1366
    Previous Daily Pivot Point S2: 1.1319
    Previous Daily Pivot Point S3: 1.1257
    Previous Daily Pivot Point R1: 1.1476
    Previous Daily Pivot Point R2: 1.1538
    Previous Daily Pivot Point R3: 1.1585

Author

Pablo Piovano

Born and bred in Argentina, Pablo has been carrying on with his passion for FX markets and trading since his first college years.


More from Pablo Piovano
Share:

Editor's Picks

GBP/USD weakens to two-week lows near 1.3520

GBP/USD trades on the back foot, returning to the low 1.3500s, or two-week troughs, on Tuesday. Cable’s bearish price action follows decent gains in the Greenback at the time when investors assess latest US data releases and the persistent uncertainty in the US-Iran crisis.

EUR/USD remains offered; breaks below 1.1600

EUR/USD now accelerates its daily correction, breaching below the key 1.1600 support level on Tuesday. The pair’s daily correction comes on the back of a decent bounce in the US Dollar despite disappointing US data releases and amid persistent geopolitical concerns.

Gold eyes $4,300 breakdown amid Fed hike bets, Iran risks, firm USD

Gold languishes near a two-and-a-half-week low, touched during the Asian session on Wednesday, awaiting a break below $4,300 before the next leg down. Escalating US-Iran tensions lift oil prices to a nearly six-week high and fuel inflation fears, reaffirming Fed rate-hike bets. This acts as a tailwind for the safe-haven US Dollar and undermines demand for the non-yielding bullion.

The debasement trade: Could the US Dollar become the next casualty?

The US Dollar has spent much of 2026 fighting familiar enemies. Federal Reserve expectations, stubborn inflation, geopolitical uncertainty and doubts about the sustainability of US fiscal policy have all taken their turn driving the world's reserve currency. Now there is another phrase creeping into market conversations: the debasement trade.

Middle East war takes its toll on Gold prices

The US Dollar accelerates its advance against the precious metal in the American session on Tuesday, following news indicating United States forces launched attacks on Islamic Revolutionary Guard Corps targets in Iran, as reported by the US Central Command. Explosions were reported on Qeshm Island, around the Strait of Hormuz, and across southern Iran.

Diesel’s record $100 warning: The oil shock hiding in plain sight

The Oil market may look calmer than it did a few months ago, but diesel is sending a very different message. The US diesel crack spread, the premium of ultra-low sulphur diesel futures over WTI, recently surged above $100 per barrel for the first time, reaching an intraday record of just over $102.00.