|

EUR/USD technical analysis: Fiber enters the New York session printing fresh weekly lows at 1.1066

  • EUR/USD is trading close to weekly lows as investors anticipate more stimulus in September from the European Central Bank (ECB).
  • The level to beat for bears is the 1.1074 support. 
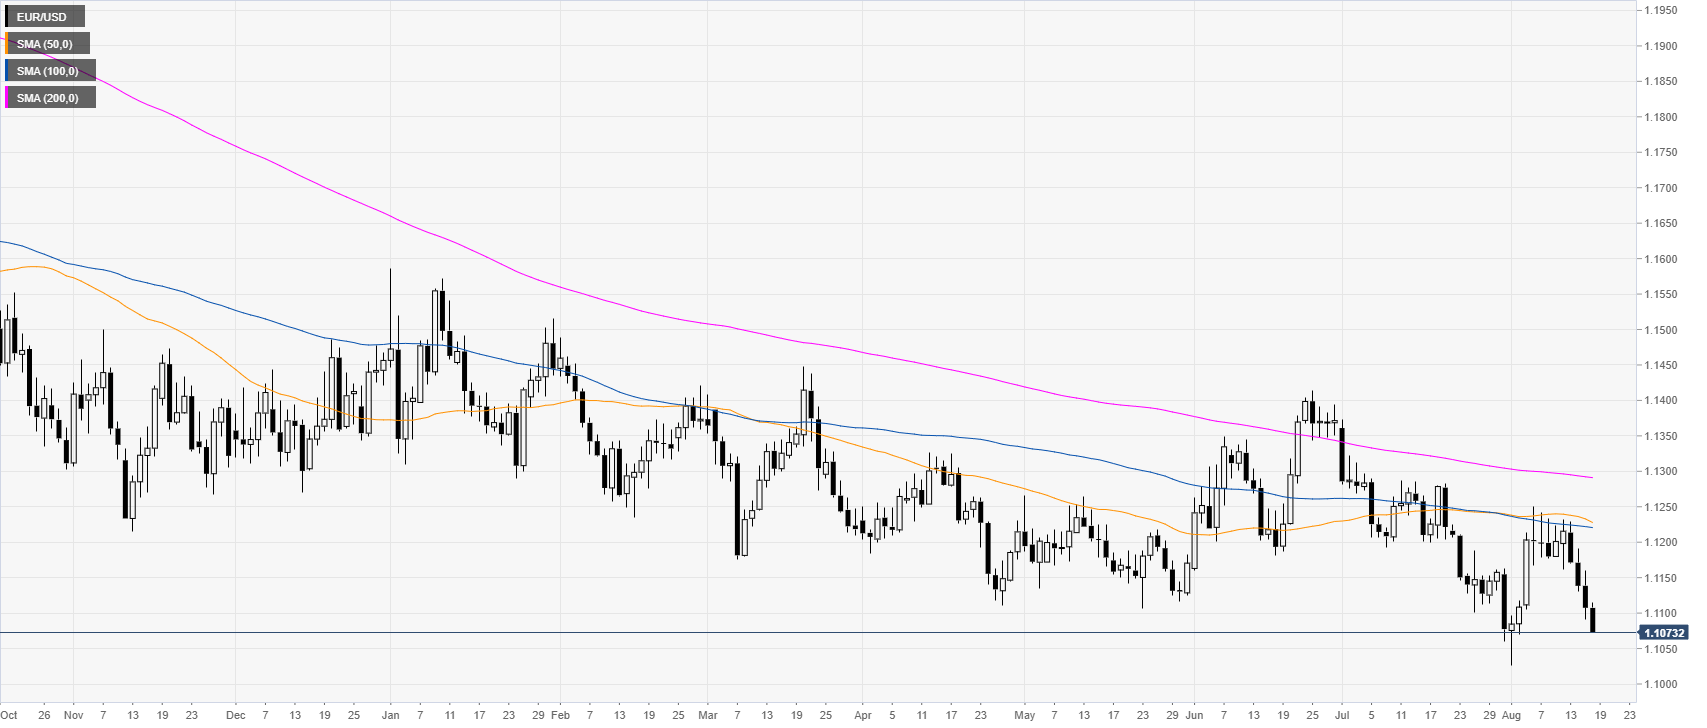


EUR/USD daily chart

 
On the daily time-frame, the single currency is trading in a bear trend below the main daily simple moving averages (DSMAs). The recent data in the US keeps the buck supported. Inflation and the Retail Sales Control Group were positive. Additionally, easing US-China trade tensions also support the Greenback. On the other hand, on Thursday ECB member Olli Rehn said the ECB stimulus package might overshoot expectations in September. The dovish comment was seen as bearish for EUR.

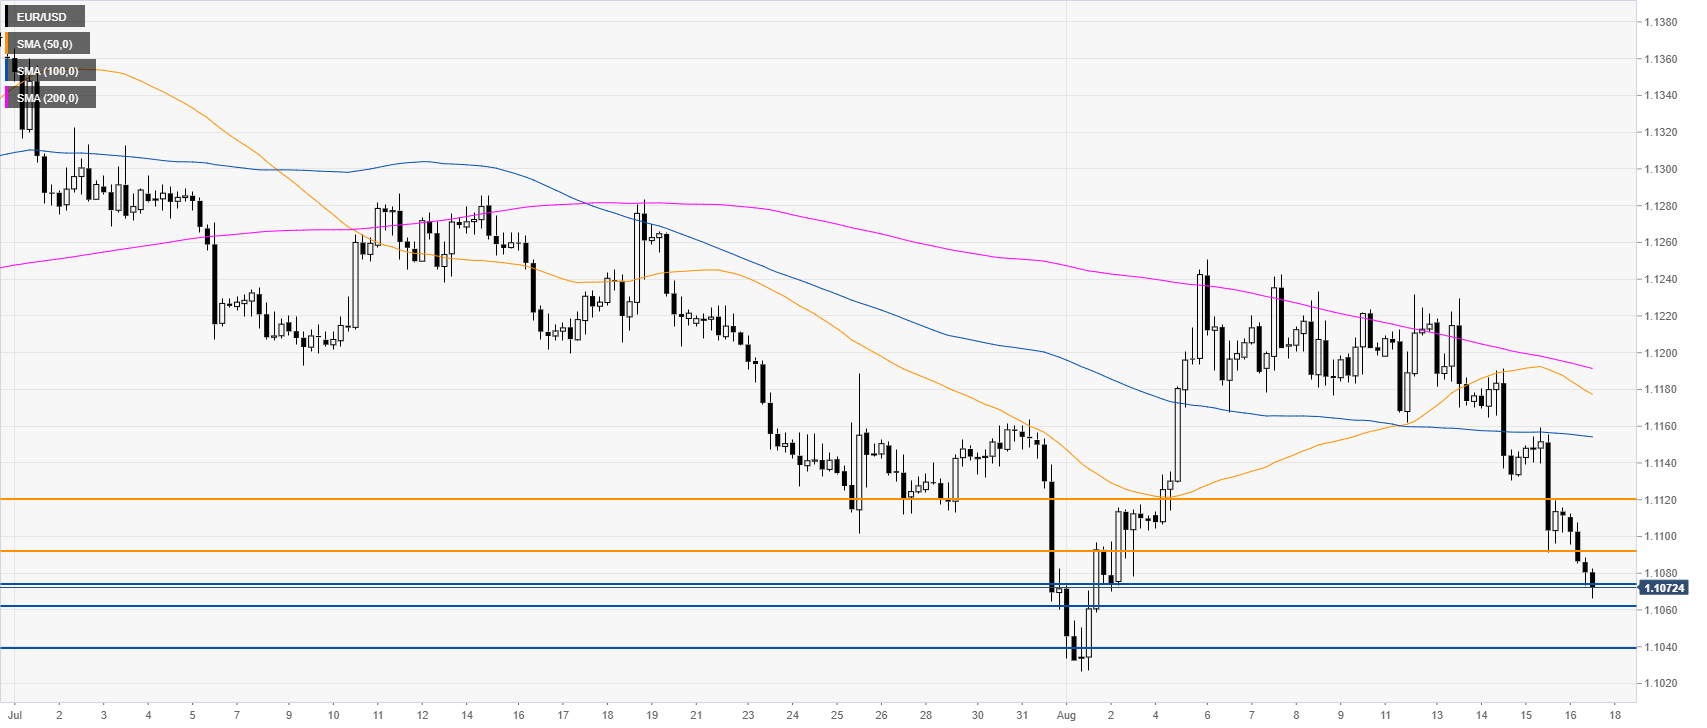
EUR/USD 4-hour chart

 
The Euro is challenging the 1.1074 support. A beak below the level could open the doors to further losses towards 1.1062 and 1.1039 levels.
 

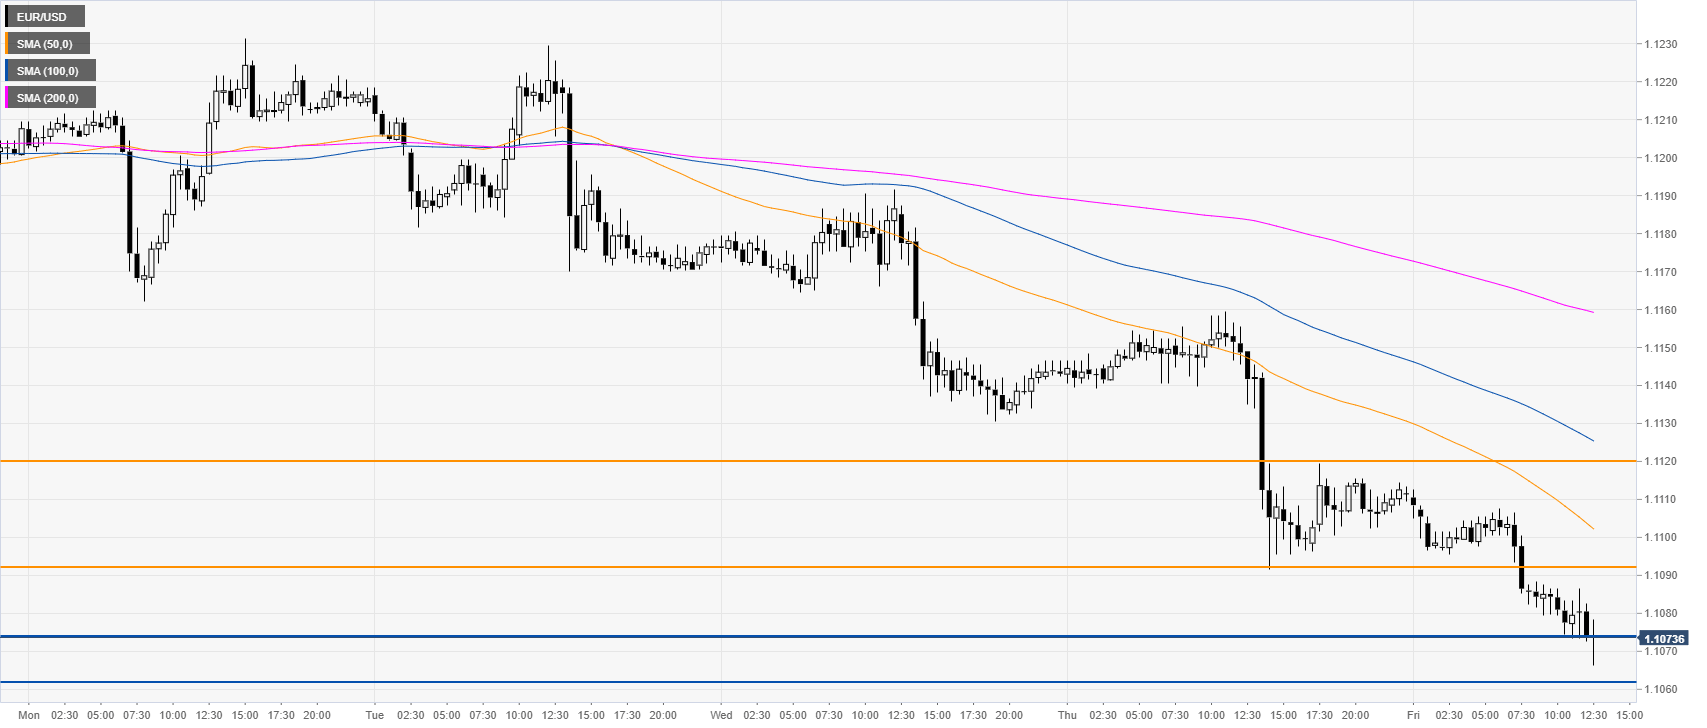
EUR/USD 30-minute chart

 
The market is under heavy bearish pressure near the weekly lows. Immediate resistances are seen at the 1.1091 and 1.1120 levels, according to the Technical Confluences Indicator


Additional key levels

EUR/USD

Overview
Today last price1.107
Today Daily Change-0.0037
Today Daily Change %-0.33
Today daily open1.1107
 
Trends
Daily SMA201.1159
Daily SMA501.1233
Daily SMA1001.1222
Daily SMA2001.1292
Levels
Previous Daily High1.116
Previous Daily Low1.1092
Previous Weekly High1.1251
Previous Weekly Low1.1104
Previous Monthly High1.1373
Previous Monthly Low1.106
Daily Fibonacci 38.2%1.1117
Daily Fibonacci 61.8%1.1134
Daily Pivot Point S11.108
Daily Pivot Point S21.1052
Daily Pivot Point S31.1012
Daily Pivot Point R11.1147
Daily Pivot Point R21.1188
Daily Pivot Point R31.1215

Author

Flavio Tosti

Flavio Tosti

Independent Analyst


More from Flavio Tosti
Share:

Editor's Picks

EUR/USD appears supported by the 200-day SMA, for now

Following an early pullback to multi-week lows near 1.1670, EUR/USD now manages to reclaim the 1.1700 region as the NA session draws to a close on Monday. The steep retracement in spot follows the equally strong move higher in the US Dollar, as investors continue to assess the geopolitical landscape in the wake of the US and Israel attacks on Iran.


GBP/USD hits new yearly lows near 1.3300

GBP/USD adds to the recent bearish tone, approaching to the key 1.3300 support to reach fresh YTD troughs against the backdrop of the robust performance of the US Dollar. Indeed, Cable’s decline comes amid the firm demand for the safe-haven space in the wake of the US and Israel attacks to Iran.

Gold eases some ground, approaches $5,300

Gold now surrenders part of the earlier advance, reshifting its attenton to the $5,300 zone per troy ounce at the beginning of the week. Indeed, the yellow metal’s firm performance appears propped up by incresing geopolitical jitters in the Middle East, which at the same time fuels the demand for the safe-haven space.

Ethereum Price Forecast: BitMine lifts ETH holdings to 4.47M, Lee predicts geopolitical impact on markets

Ethereum (ETH) treasury firm BitMine Immersion (BMNR) bought another 50,928 ETH last week, sending its stash of the top altcoin to 4.47 million ETH worth about $8.9 billion at the time of publication.

The Fed is finally talking about AI – Here's why it matters for the US Dollar

AI is moving from earnings calls into the heart of monetary policy discussions, forcing Federal Reserve officials to confront a new question: How to act if AI reshapes inflation, employment and interest rates at the same time?

Grass 20% bullish breakout defies broader market weakness

Grass (GRASS) is edging up above $0.30 at the time of writing on Monday. The token’s notable 20% intraday surge stands out amid heightened volatility in the broader crypto market.