|

EUR/USD technical analysis: Euro rises near 1.1257 resistance on dovish Fed message

  • EUR/USD rises to new weekly highs almost reaching 1.1257 resistance.
  • If 1.1257 resistance is broken the next main bull target can be seen at 1.1344.  

The US Dollar is weakening across the board as the Fed is hinting at cutting rates. 

EUR/USD daily chart

EUR/USD is trading in a bear trend below its 100 and 200 simple moving average (DSMA). The market trades above the 1.1200 figure its 50 SMA still trapped in the range of the last 3 days.


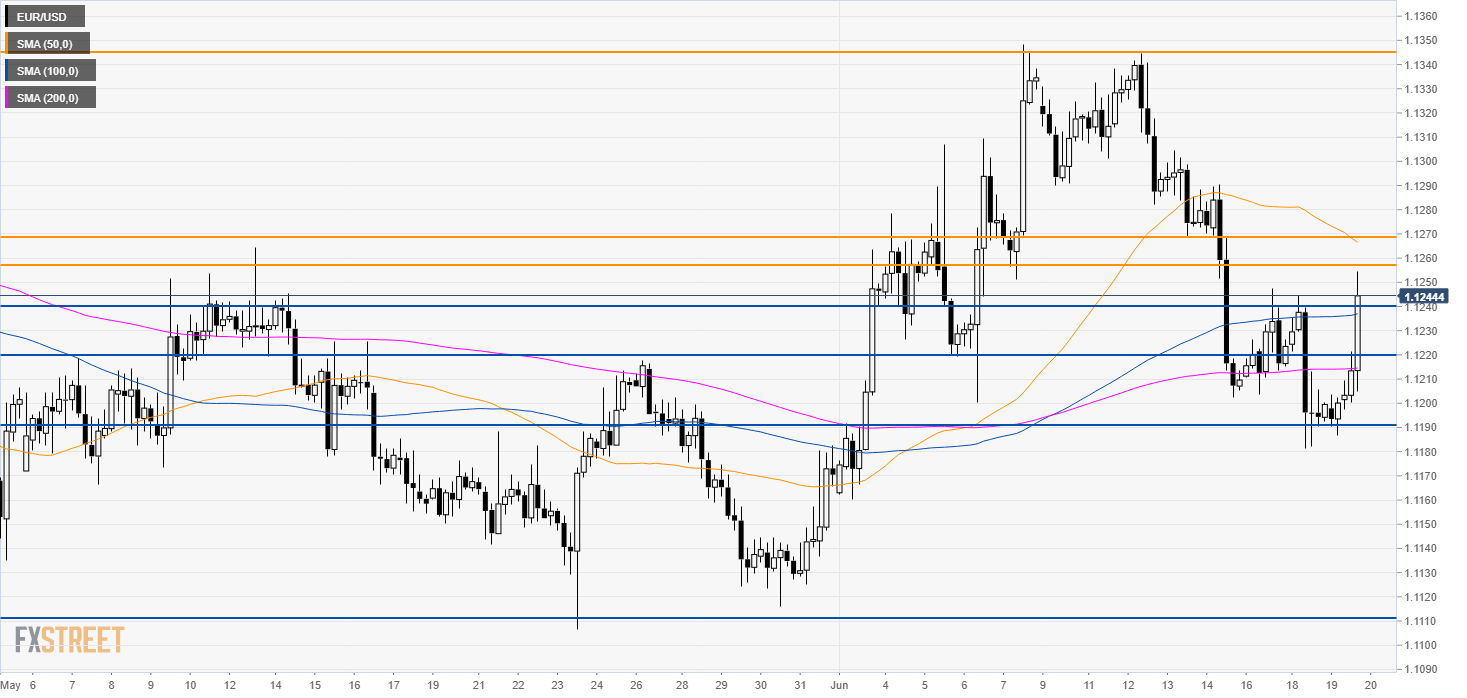
EUR/USD 4-hour chart

The market broke above 1.1240 and almost reached 1.1257 (Monthly Pivot Point R1). 


EUR/USD 30-minute chart

EUR/USD is trading above its main SMAs suggesting bullish momentum in the medium term. The level to beat for bulls become 1.1257 to get to 1.1268 which seems the last bastion of resistance before 1.1344 (previous week high and monthly Pivot Point Resistance 2), according to the Technical Confluence Indicator. Support levels are seen at 1.1220 and 1.1190. 

Additional key levels

EUR/USD

Overview
Today last price1.1246
Today Daily Change0.0052
Today Daily Change %0.46
Today daily open1.1194
 
Trends
Daily SMA201.1224
Daily SMA501.1218
Daily SMA1001.1267
Daily SMA2001.1357
Levels
Previous Daily High1.1244
Previous Daily Low1.1181
Previous Weekly High1.1344
Previous Weekly Low1.1202
Previous Monthly High1.1266
Previous Monthly Low1.1107
Daily Fibonacci 38.2%1.1205
Daily Fibonacci 61.8%1.122
Daily Pivot Point S11.1168
Daily Pivot Point S21.1143
Daily Pivot Point S31.1105
Daily Pivot Point R11.1232
Daily Pivot Point R21.127
Daily Pivot Point R31.1295

Author

Flavio Tosti

Flavio Tosti

Independent Analyst


More from Flavio Tosti
Share:

Editor's Picks

EUR/USD eyes nine-day EMA barrier after rebounding from 1.1600

EUR/USD gains ground after registering modest losses in the previous session, trading around 1.1620 during the Asian hours on Friday. The technical analysis of the daily chart suggests an ongoing bearish bias as the pair remains within the descending channel pattern.

GBP/USD: Pound Sterling ticks up against US Dollar in countdown to US NFP

The Pound Sterling trades marginally higher to near 1.3365 against the US Dollar during the Asian trading session on Friday. The GBP/USD pair edges up as the US Dollar ticks down ahead of the United States Nonfarm Payrolls data for February, which will be published at 13:30 GMT.

Gold awaits US Nonfarm Payrolls for a clear directional impetus

Gold rebounds above $5,100 early Friday after testing the $5,050 level amid global sell-off. The US Dollar pulls back as profit-taking creeps in ahead of US labor data. For February. 21-day SMA holds amid bullish RSI; a daily closing above 61.8% Fibo is critical for Gold buyers.

Top Crypto Gainers: Lombard, Humanity Protocol, OKB rally on US Fed’s tokenized securities clarity, NYSE investment

Lombard, Humanity Protocol, and OKB rally over the last 24 hours, securing the top-gainer spots in the early Asian session. The US Federal Reserve issued clarity on tokenized securities, which expands its utility and reduces regulatory friction with US banks, driving the Real-World Assets tokenization crypto projects. 

The market compass is pointing at a barrel of Oil

The Asian open is arriving with equities leaning the wrong way, and the reason is not complicated. The market’s compass needle has snapped firmly toward crude. In this tape, oil is not just another input price; it is the gravitational center around which every asset class is orbiting.

Ripple tests recovery strength amid steady ETF inflows, growing retail interest

Ripple (XRP) continues to demonstrate notable resilience as the cryptocurrency market navigates the persistent war in the Middle East after the United States (US) and Israel attacked Iran on Saturday.