|

EUR/USD Technical Analysis: Euro near 1.1350 post-ECB Minutes
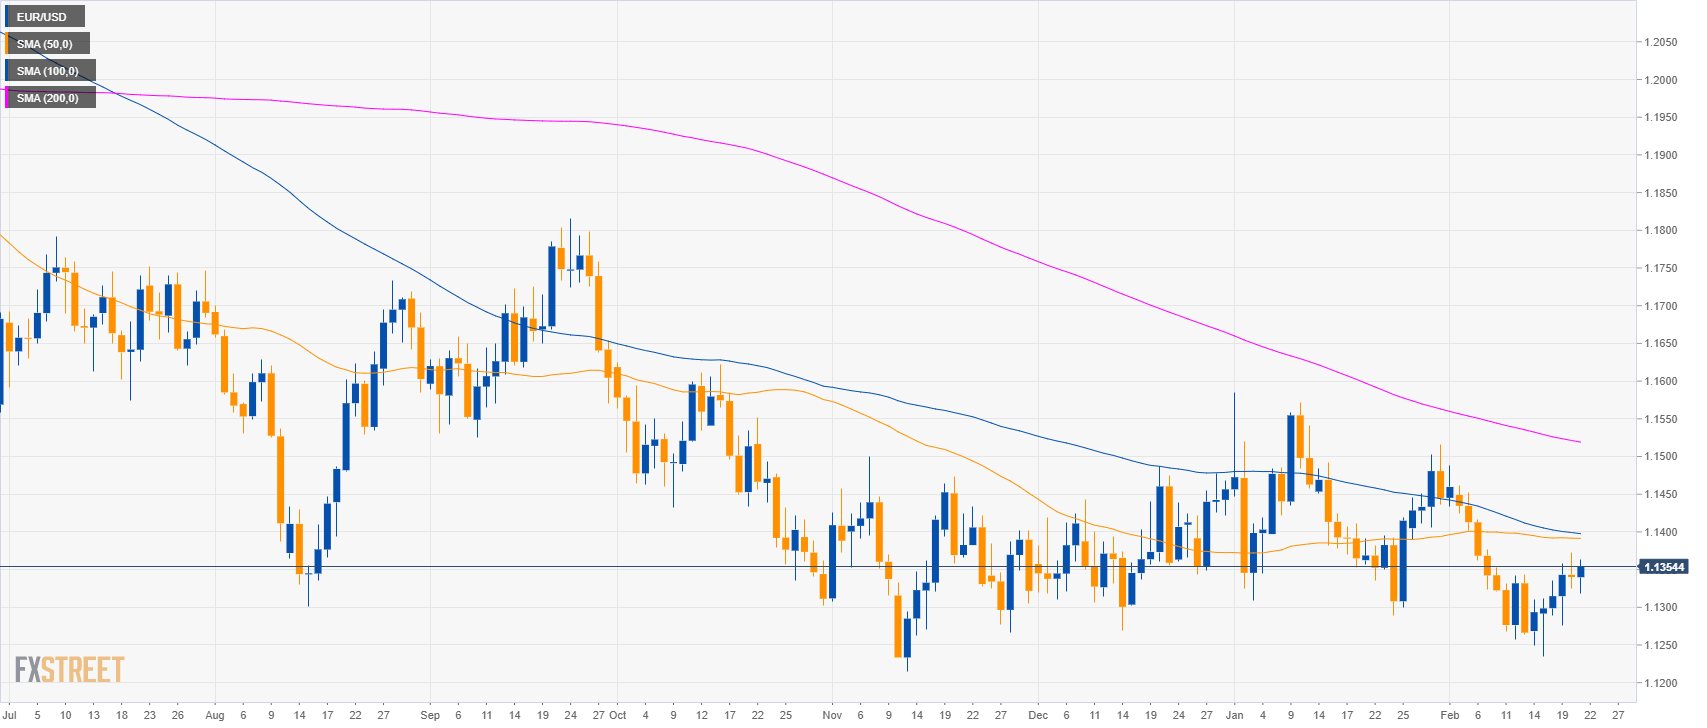
EUR/USD daily chart

  • EUR/USD is evolving in a bear trend below the 200-day simple moving average (SMA).
  • The ECB minutes of the January meeting confirmed the ECB's increasing concerns regarding the economic slowdown. The confidence indicators though might prevent the central bank from twitching at the March meeting.


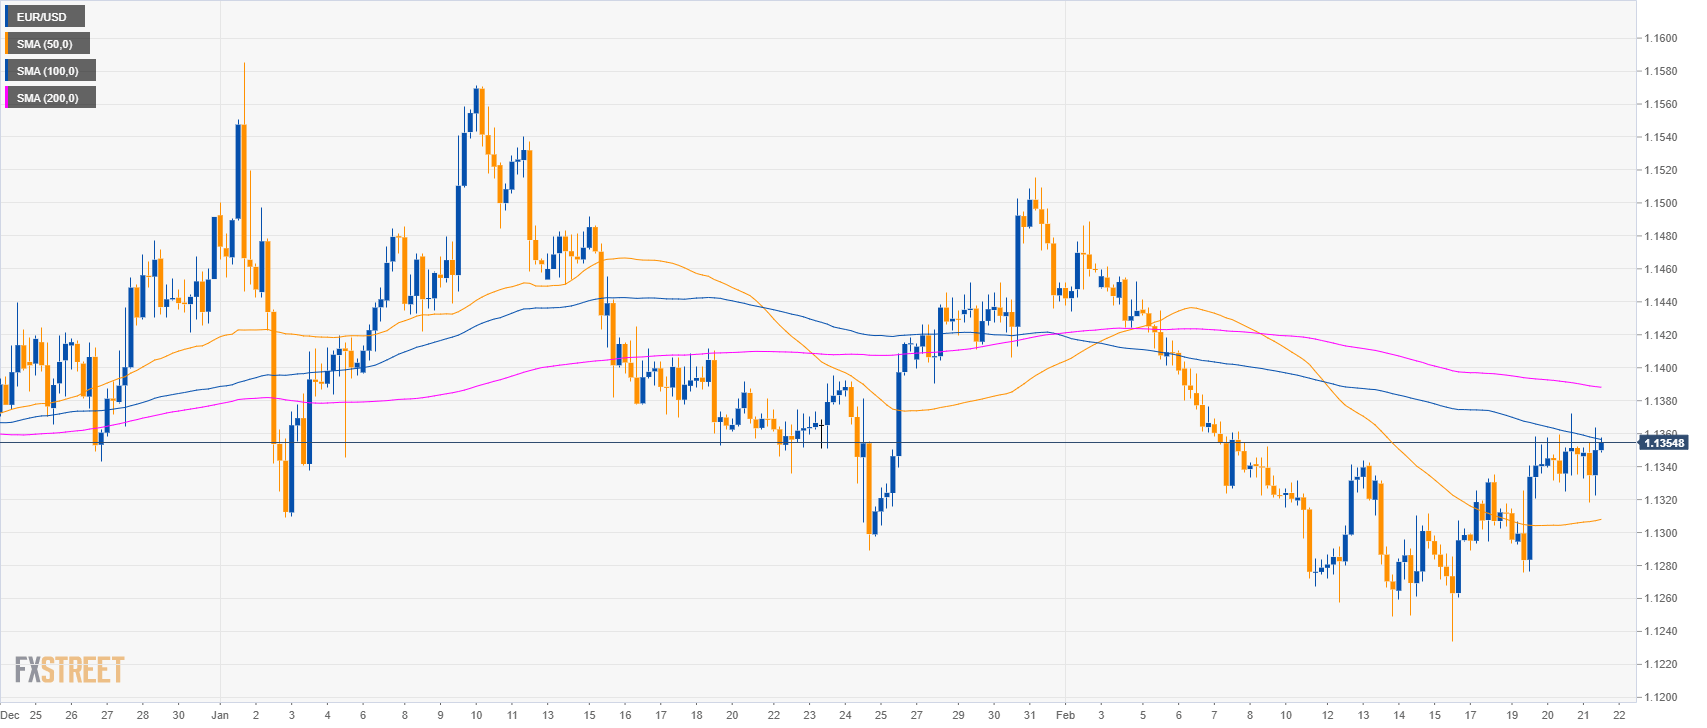
EUR/USD 4-hour chart

  • EUR/USD is currently testing the 100 SMA.
https://editorial.azureedge.net/miscelaneous/240-636863521070614833.png


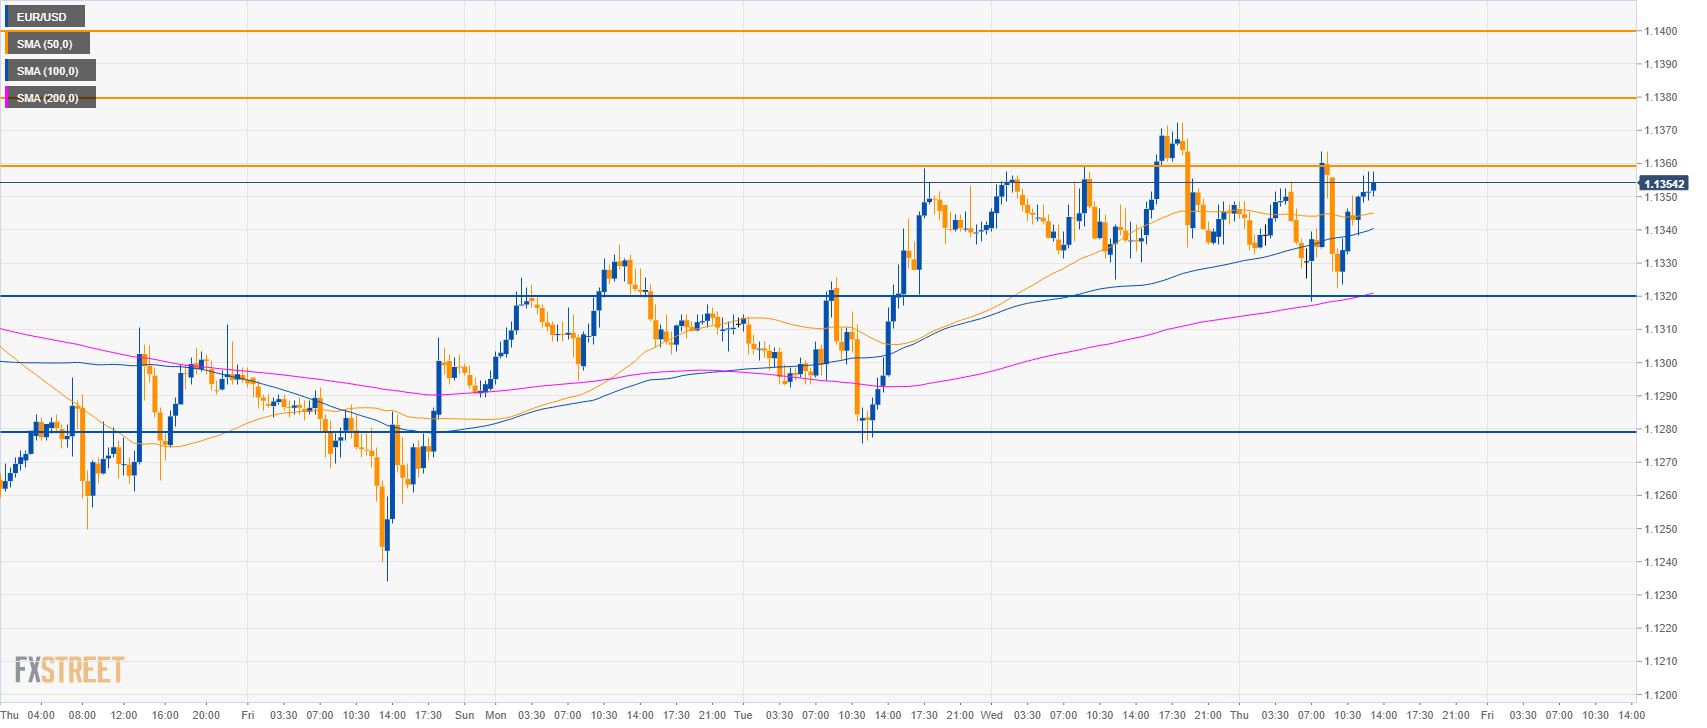
EUR/USD 30-minute chart

  • EUR/USD is trading above its main SMAs suggesting bullish momentum.
  • A break above 1.1360 should reach 1.1380 and 1.1400 figure to the upside.
  • Looking down, support is at 1.1320 and 1.1280 key level.

Additional key levels:

EUR/USD

Overview:
    Today Last Price: 1.1354
    Today Daily change: 14 pips
    Today Daily change %: 0.12%
    Today Daily Open: 1.134
Trends:
    Daily SMA20: 1.1366
    Daily SMA50: 1.1392
    Daily SMA100: 1.1399
    Daily SMA200: 1.1521
Levels:
    Previous Daily High: 1.1373
    Previous Daily Low: 1.1325
    Previous Weekly High: 1.1344
    Previous Weekly Low: 1.1234
    Previous Monthly High: 1.1586
    Previous Monthly Low: 1.1289
    Daily Fibonacci 38.2%: 1.1343
    Daily Fibonacci 61.8%: 1.1354
    Daily Pivot Point S1: 1.1319
    Daily Pivot Point S2: 1.1298
    Daily Pivot Point S3: 1.1272
    Daily Pivot Point R1: 1.1367
    Daily Pivot Point R2: 1.1393
    Daily Pivot Point R3: 1.1414

Author

Flavio Tosti

Flavio Tosti

Independent Analyst


More from Flavio Tosti
Share:

Editor's Picks

EUR/USD seems fragile below 1.1700 as Middle East war boosts energy prices

The EUR/USD pair trades flat at around 1.1680 during the Asian trading session on Tuesday, but broadly seems vulnerable, being close to its five-week low. The major currency pair is under pressure as surging oil prices due to the United States-Israel war with Iran have increased the risks of higher inflation for the Old Continent.

GBP/USD hovers around 1.3400 with bearish pressure intact

GBP/USD edges higher after three days of losses, trading around 1.3400 during the Asian hours on Tuesday. The technical analysis of the daily chart indicates an ongoing bearish bias, as the pair trades within a descending channel pattern.

Gold stays bullish as Iran war continues to spur safe-haven flows

Gold is finding renewed bids in Asian trades on Tuesday, making another attempt to regain the $5,400 level amid persistent demand for safe-haven assets as the Iran war extends. A softer risk tone remains in play as US President Donald Trump continues to threaten deeper escalation to the ongoing war with Iran, warning that a “big wave” is yet to come.

Top Crypto Gainers: Near Protocol, Virtuals Protocol, and Morpho lead market recovery

Near Protocol, Virtuals Protocol, and Morpho are leading the market recovery with double-digit gains over the last 24 hours. Technically, NEAR extends the breakout of the falling channel pattern, VIRTUAL holds above the 50-day EMA, while MORPHO tests a crucial resistance. 

The market is not panicking it is repricing the probability distribution of Oil and time

At the end of the day, markets do not trade morality or geopolitics. They trade transmission channels. And the only channel that truly matters in this maelstrom runs through the price of energy and the time value of money.

Grass 20% bullish breakout defies broader market weakness

Grass (GRASS) is edging up above $0.30 at the time of writing on Monday. The token’s notable 20% intraday surge stands out amid heightened volatility in the broader crypto market.