EUR/USD stumbles on Fed rate hike speculations, slides below 1.1000
- EUR/USD falls for the second straight day, as sellers are eyeing 1.0800.
- US New York Empire State Manufacturing Index climbed for the first time in five months.
- EUR/USD Price Analysis: Could register a pullback in the near term before resuming upwards.

EUR/USD losses traction on technical reasons and on a stronger US Dollar (USD, as speculations that the US Federal Reserve (Fed) would hike rates in May, gains adepts. US Treasury bond yields rose; consequently, bonds dropped, a tailwind for the buck. At the time of writing, the EUR/USD is trading at 1.0911 after hitting a YTD high at 1.1075.
Growing adepts for a US central bank 25 bps rate hike boosted the USD
Wall Street trades with a risk-off-tilted mood. The economic docket in the United States (US) and the Eurozone (EU) is light, with the main driver of EUR/USD’s price action being the US 2-year Treasury bond yield. The US 2-year bond yield is gaining almost 10 bps, sitting at 4.194%, while the CME FedWatch Tool shows odds for a 25 bps rate hike by the Fed, at 84.7%, higher than last Friday’s 78%.
The US Dollar Index (DXY) continues to advance and tests the 20-day EMA around 102.321. A break above it could expose the 103.000 mark.
Data-wise, the New York Factory Empire State Manufacturing Index unexpectedly jumped in April, from -24.5 to 10.8, exceeding forecasts for a -18 plunge. Orders and shipments rising were the reasons behind the expansion, while a measure of prices paid fell 9 points.
On the Eurozone front, inflation in Italy rose by 7.6%, beneath the consensus and below February’s 9.1%. In the meantime, the European Central Bank (ECB) President, Christine Lagarde, is crossing newswires, but she’s not commenting about monetary policy. Earlier, some ECB members crossed newswires, led by Nagel, who's expecting inflation to slow before the summer break. Later, ECB's Kazaks commented that the ECB has the option of 50 or 25 bps at the upcoming May meeting.
What to watch?
Ahead of the week, the EU will reveal the Zew Economic Sentiment Index for the bloc and Germany, alongside the EU’s Balance of Trade. On the US front, Housing data, and Fed Bowman, will cross newswires.
EUR/USD Technical Analysis
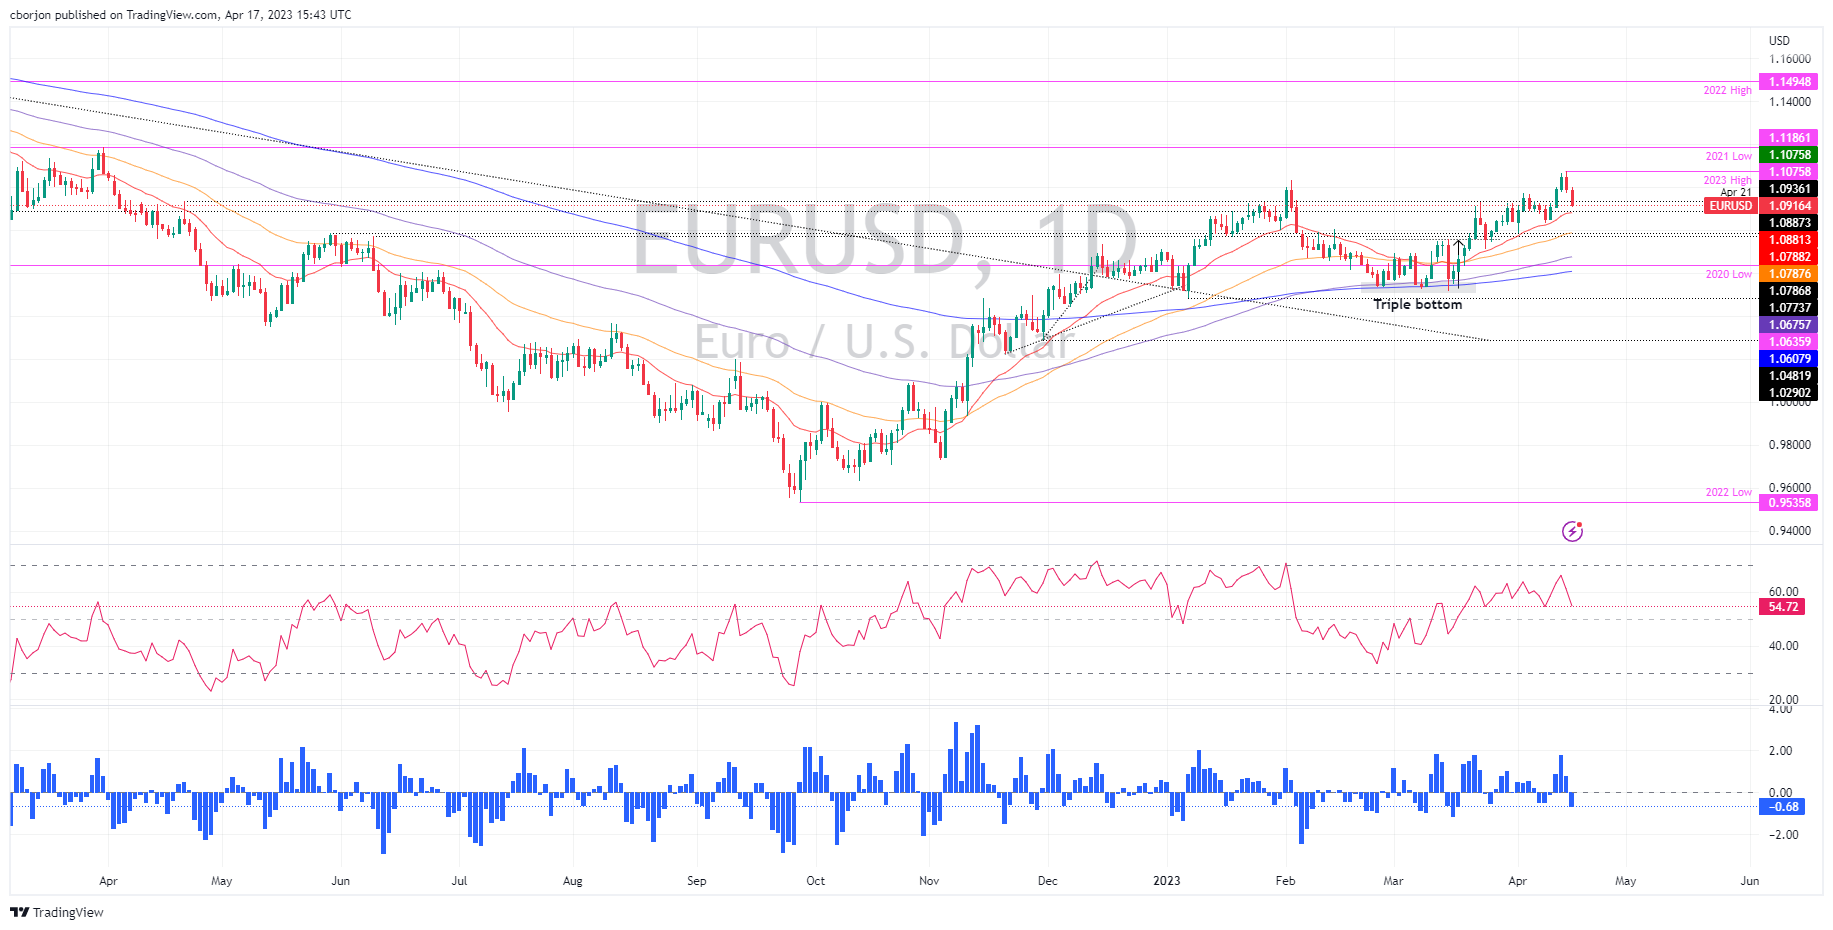
The EUR/USD is still upward biased, though after hitting a new YTD high at 1.1075, it has retreated below 1.1000. Additionally, oscillators like the Relative Strength Index (RSI) aiming downward, the same as the Rate of Change (RoC), suggest that buyers are losing momentum. Therefore, the EUR/USD path of least resistance is downwards in the near term.
The EUR/USD first support would be 1.0900, followed by the 20-day Exponential Moving Average (EMA) at 1.0881. A decisive break would tumble the pair towards the 50-day EMA At 1.0800.
Author

Christian Borjon Valencia
FXStreet
Markets analyst, news editor, and trading instructor with over 14 years of experience across FX, commodities, US equity indices, and global macro markets.

















