EUR/USD Price Forecast: Buyers challenge 100-day SMA as momentum turns bullish
- EUR/USD retains a mildly bullish bias while holding above the 50-day SMA.
- RSI and MACD indicators show that buyers still hold the upper hand.
- The 100-day and 200-day SMAs cap the upside ahead of the 1.1700 barrier.

EUR/USD trades on the back foot on Thursday, snapping a two-day winning streak as the US Dollar (USD) steadies. Still, the near-term technical picture remains bullish following the late-July rebound from below 1.1400. At the time of writing, the pair trades around 1.1534, down 0.15% on the day.
Traders await the US Nonfarm Payrolls (NFP) report scheduled for Friday, which could shape Federal Reserve (Fed) interest rate expectations and drive volatility in EUR/USD.
Analysts at Scotiabank note that “fundamentals remain supportive and the EUR’s recent recovery has closely mirrored the turn in yield spreads,” with spot now trading close to their fair-value estimates. However, they caution that “further gains will likely require some further shift in the outlook for relative central bank policy or an improvement in sentiment, as risk reversals reveal a continued premium for protection against EUR weakness.”
From a technical perspective, Scotiabank describes the setup as “bullish—the latest recovery in the RSI is important, climbing into bullish territory with a push to the low 60s,” but still expects consolidation, stating that “we look to a near-term range bound between 1.1500 and 1.1600.”
Technical analysis
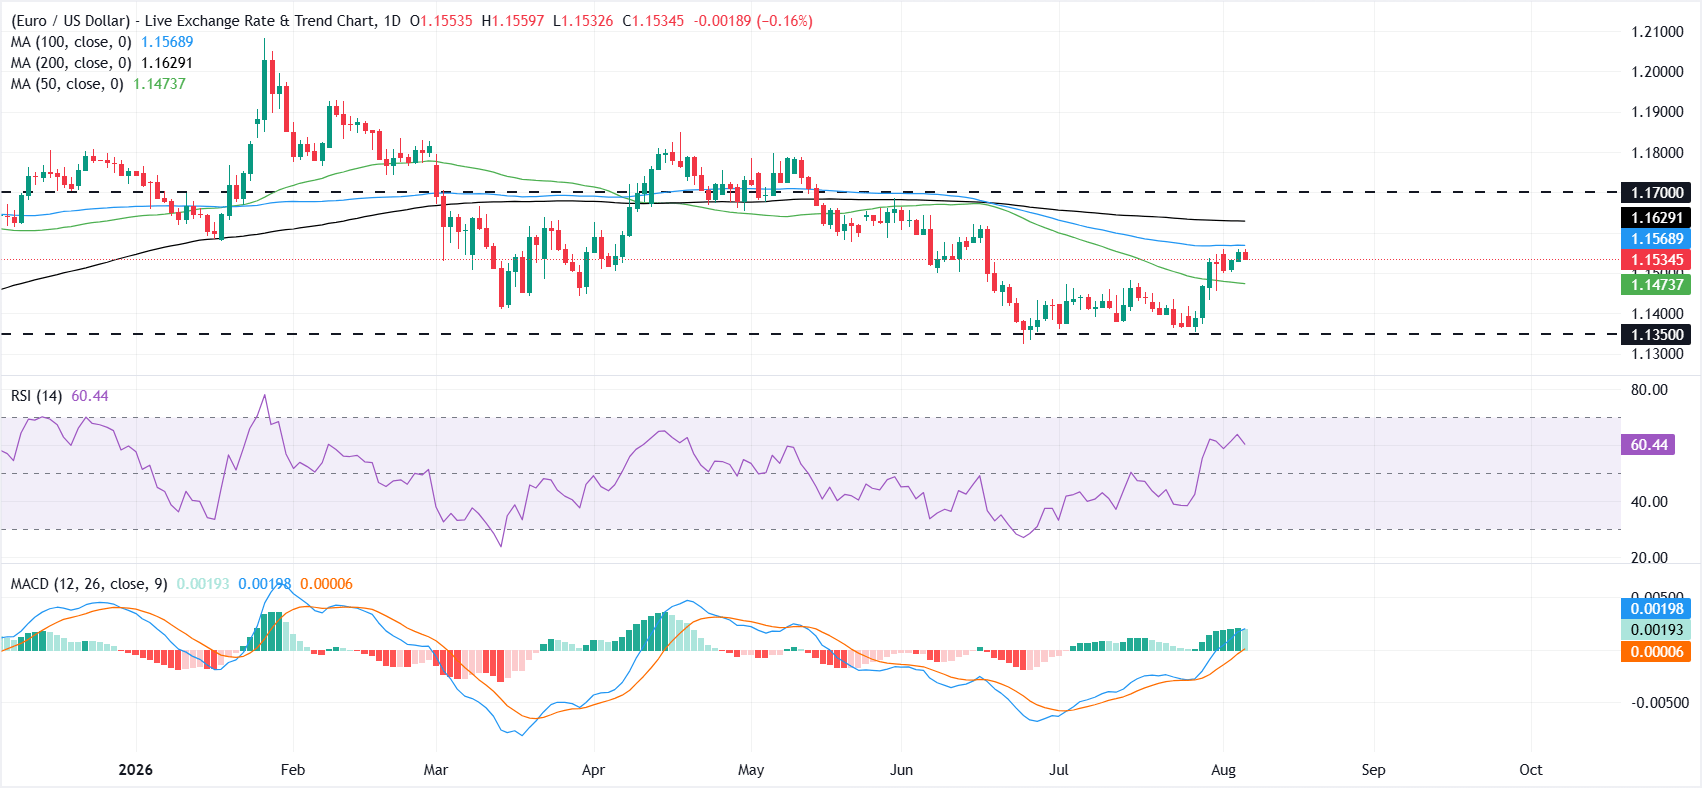
On the daily chart, EUR/USD maintains a mildly bullish near-term tone as it holds above the 50-day Simple Moving Average (SMA) at 1.1474. However, topside progress is already challenged by the 100-day SMA at 1.1569 and the 200-day SMA at 1.1629, which cap the advance for now.
Momentum remains constructive, with the Relative Strength Index (RSI) around 61 and the Moving Average Convergence Divergence (MACD) line in positive territory, hinting that buyers still have the upper hand while the pair trades above its short-term trend support.
On the downside, immediate support is seen at the 50-day SMA at 1.1474, ahead of a more significant horizontal floor near 1.1350. On the topside, initial resistance is located at the 100-day SMA at 1.1569, followed by the 200-day SMA at 1.1629, while a stronger barrier awaits at the horizontal level of 1.1700.
A daily close above the 100-day SMA would open the way toward the 1.1629-1.1700 band, whereas a loss of the 1.1474 support area would suggest that the current bullish bias is starting to erode.
(The technical analysis of this story was written with the help of an AI tool. Know more.)
US Dollar Price Today
The table below shows the percentage change of US Dollar (USD) against listed major currencies today. US Dollar was the strongest against the Swiss Franc.
| USD | EUR | GBP | JPY | CAD | AUD | NZD | CHF | |
|---|---|---|---|---|---|---|---|---|
| USD | 0.17% | 0.00% | 0.28% | 0.04% | 0.26% | 0.12% | 0.31% | |
| EUR | -0.17% | -0.16% | 0.13% | -0.13% | 0.07% | -0.03% | 0.14% | |
| GBP | -0.01% | 0.16% | 0.30% | 0.04% | 0.24% | 0.11% | 0.31% | |
| JPY | -0.28% | -0.13% | -0.30% | -0.24% | -0.04% | -0.16% | 0.04% | |
| CAD | -0.04% | 0.13% | -0.04% | 0.24% | 0.21% | 0.10% | 0.29% | |
| AUD | -0.26% | -0.07% | -0.24% | 0.04% | -0.21% | -0.12% | 0.07% | |
| NZD | -0.12% | 0.03% | -0.11% | 0.16% | -0.10% | 0.12% | 0.22% | |
| CHF | -0.31% | -0.14% | -0.31% | -0.04% | -0.29% | -0.07% | -0.22% |
The heat map shows percentage changes of major currencies against each other. The base currency is picked from the left column, while the quote currency is picked from the top row. For example, if you pick the US Dollar from the left column and move along the horizontal line to the Japanese Yen, the percentage change displayed in the box will represent USD (base)/JPY (quote).
Author

Vishal Chaturvedi
FXStreet
I am a macro-focused research analyst with over four years of experience covering forex and commodities market. I enjoy breaking down complex economic trends and turning them into clear, actionable insights that help traders stay ahead of the curve.