|

EUR/USD Price Analysis: Consolidates around 1.0765-70 area/100-day SMA, US CPI awaited

  • EUR/USD remains confined in a narrow trading band for the second straight day.
  • The technical setup warrants some caution before placing fresh directional bets.
  • Traders now look to the US CPI for fresh impetus amid dovish Fed/ECB pricing.

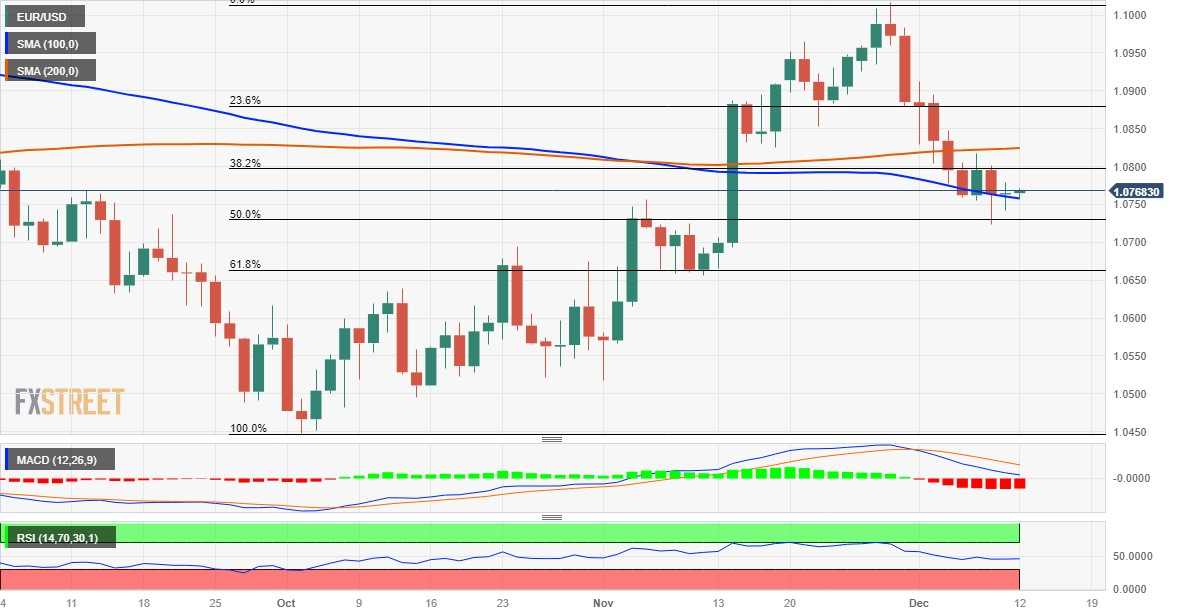
The EUR/USD pair extends its sideways consolidative price move for the second successive day on Tuesday and remains well within the striking distance of the monthly low, around the 1.0725-1.0720 region touched last week. Spot prices currently trade around the 1.0765-1.0770 area, nearly unchanged for the day, as traders keenly await the release of the US consumer inflation figures for a fresh impetus.

In the run-up to the key data risk, reduced bets for the first interest rate cut by the Federal Reserve (Fed) in March 2024 act as a tailwind for the US Dollar (USD). The shared currency, on the other hand, is undermined by speculations that the European Central Bank (ECB) may start cutting interest rates early next year amid a bigger-than-expected fall in the Eurozone inflation last month. This, in turn, is holding back traders from placing aggressive directional bets around the EUR/USD pair and leading to a subdued range-bound price action.

From a technical perspective, spot prices on Friday showed resilience below the 50% Fibonacci retracement level of the October-November rally and so far, managed to defend the 100-day Simple Moving Average (SMA) on a daily closing basis. This makes it prudent to wait for a sustained break and acceptance below the 1.0725 region before positioning for an extension of the recent pullback from a multi-month peak touched in November. The EUR/USD pair might then weaken below the 1.0700 mark and test the 61.8% Fibo. level, around the 1.0670-1.0665 zone.

On the flip side, the 1.0800 round figure, coinciding with the 38.2% Fibo. breakpoint, now seems to act as an immediate strong barrier ahead of the 200-day SMA, around the 1.0825 region. Some follow-through buying has the potential to lift the EUR/USD pair back closer to the 1.0900 mark. The momentum could get extended further towards the next relevant hurdle near the 1.0940 horizontal zone, above which bulls could make a fresh attempt to conquer the 1.1000 psychological mark.

EUR/USD daily chart
fxsoriginal

Technical levels to watch

EUR/USD

Overview
Today last price1.0768
Today Daily Change0.0003
Today Daily Change %0.03
Today daily open1.0765
 
Trends
Daily SMA201.0874
Daily SMA501.071
Daily SMA1001.0761
Daily SMA2001.0823
 
Levels
Previous Daily High1.0779
Previous Daily Low1.0742
Previous Weekly High1.0895
Previous Weekly Low1.0724
Previous Monthly High1.1017
Previous Monthly Low1.0517
Daily Fibonacci 38.2%1.0765
Daily Fibonacci 61.8%1.0756
Daily Pivot Point S11.0745
Daily Pivot Point S21.0725
Daily Pivot Point S31.0707
Daily Pivot Point R11.0782
Daily Pivot Point R21.0799
Daily Pivot Point R31.0819

Author

Haresh Menghani

Haresh Menghani is a detail-oriented professional with 10+ years of extensive experience in analysing the global financial markets.


More from Haresh Menghani
Share:

Editor's Picks

AUD/USD consolidates near 0.7000 as USD stays weak

AUD/USD holds steady above 0.7000 during Thursday’s Asian session, consolidating the previous day’s recovery gains from a near three-week low as the Democratic sweep in the US midterm elections and Iran diplomacy hopes continue to weigh on the US Dollar. Bulls, however, seem hesitant as focus shifts to Friday’s crucial US NFP report.

USD/JPY drifts lower to 158.25 on hawkish BoJ Minutes, weak USD

USD/JPY trades with a negative bias for the second straight day on Thursday as hawkish BoJ Minutes, showing members agreed to keep raising rates, and intervention risks support the Japanese Yen. Meanwhile, US midterm election results and hopes for Iran diplomacy keep the US Dollar depressed as focus shifts to Friday’s US NFP report.

Gold consolidates gains around $4,100

Gold now surrenders part of its initial bull run, although it sticks to the $4,100 region per troy ounce on Thursday. The yellow metal extends it recovery on the back of the lacklustre performance of the US Dollar and declining US Treasury yields following the US midterms elections.

The memory trade collapses as Sandisk sheds 17%, Micron sinks to May levels
If Wednesday's stock market rally was a broad vote of confidence in the Democratic sweep of the US midterm elections, Thursday is the other side of that coin. While the AI sell-off already began on Wednesday, it has kicked into higher gear on Thursday. The NASDAQ Composite has swung to a 4% loss in the morning regular session, while the S&P 500 and Dow Jones also shed Wednesday's gains.
NFP stress test: Six payrolls releases, measured in daily-loss limits

Friday's US employment report is usually previewed in terms of the headline number and the reaction in the Dollar. For a growing group of traders, those running funded or evaluation accounts with a fixed daily loss limit, there is a more practical question: how much of that limit can the first hour consume, regardless of direction?

US Dollar breaks below 101.50 as Democrats sweep Congress
The US Dollar (USD) comes under heavy selling pressure on Wednesday, with the US Dollar Index (DXY) falling around 0.5% to trade near 101.35 after sliding below the 101.50 level. The Greenback retreats to its lowest level in four weeks as investors reassess the political and economic outlook following the Democratic Party's sweeping victory in the United States (US) midterm elections.