|

EUR/USD Price Analysis: Pair plunges below the 1.0500 level

  • The EUR/USD fell by more than 1% to open the week.
  • The 1.0500 mark is gone and the pair fell further below the 20-day SMA.
  • Indicators suggest that the selling momentum may have more room to go.

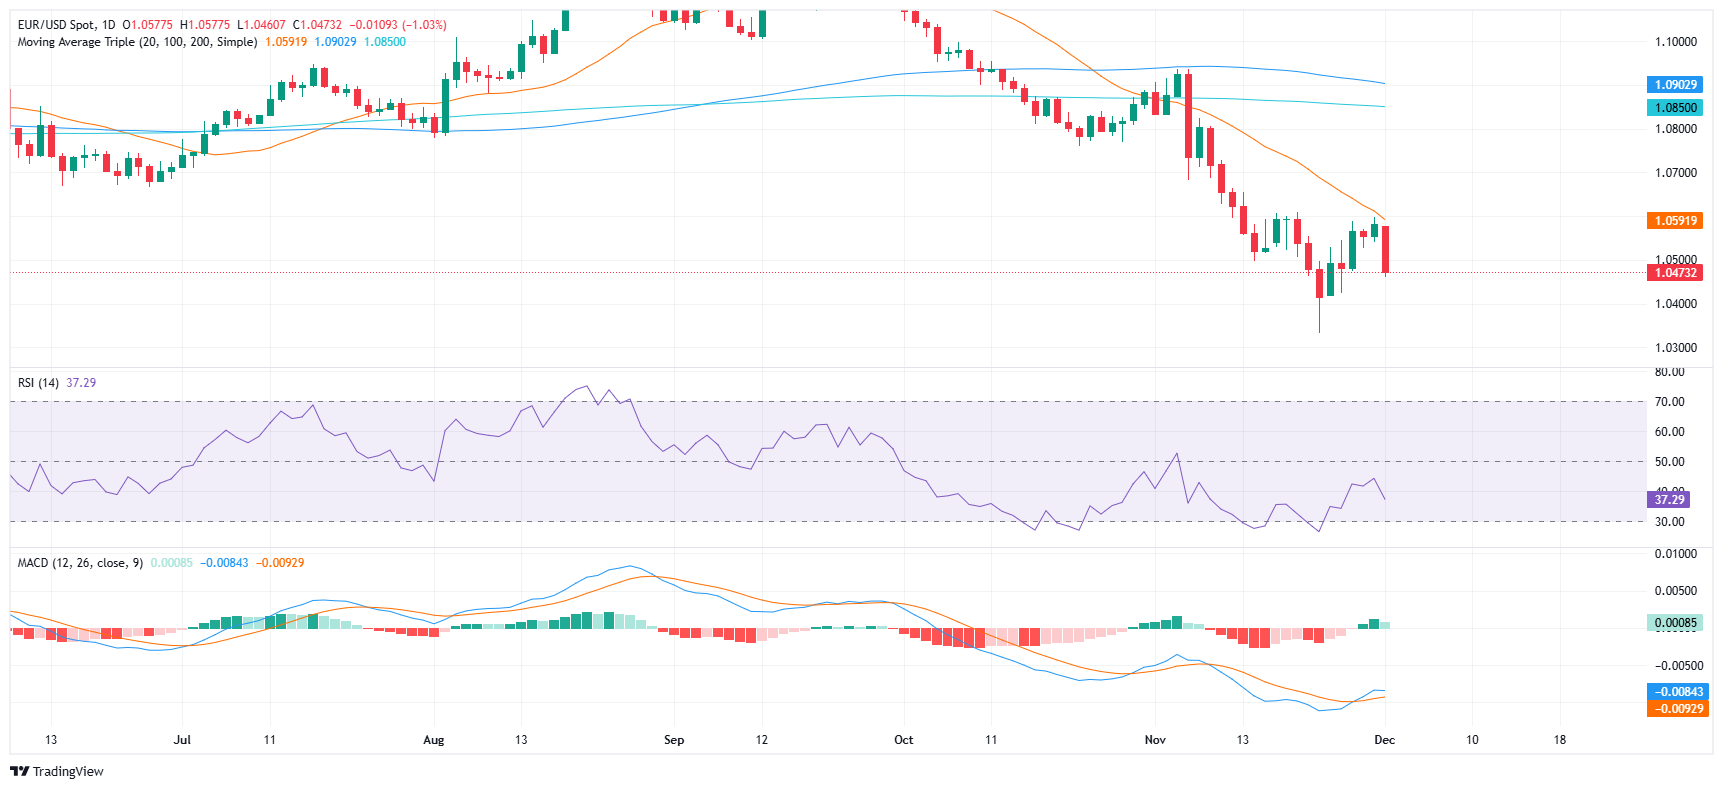
The EUR/USD pair kicked off the week with a sharp decline, falling over 1% and decisively breaking below the psychological 1.0500 mark. This move also pushed the pair further beneath the 20-day Simple Moving Average (SMA) which has acted recently as a strong resistance.

The technical indicators align with the bearish outlook, suggesting that further downside may be in play. The Relative Strength Index (RSI) is pointing downward at 37, inching closer to oversold territory but still indicating room for more selling pressure. Meanwhile, the MACD histogram is printing lower green bars, reinforcing the view that bearish momentum is strengthening.

The break below 1.0500 and the technical indicators suggest that the pair is poised for further losses unless a significant reversal catalyst emerges. Traders will be closely watching the 1.0450 and 1.0430 levels for signs of potential stabilization or a continuation toward 1.0400.

EUR/USD daily chart

Author

Patricio Martín

Patricio is an economist from Argentina passionate about global finance and understanding the daily movements of the markets.

More from Patricio Martín
Share:

Editor's Picks

GBP/USD appears well offered near 1.3160

GBP/USD builds on Tuesday’s losses, although it now manages to pick up some pace and bounce off earlier multi-month troughs near 1.3140. The Greenback’s solid performance and continued political turmoil in the UK are keeping Cable under persistent pressure, with little sign of a meaningful recovery.

EUR/USD trims losses, hovers around 1.1350

EUR/USD now regains some composure and rebounds to the 1.1350 zone on Wednesday, partially reversing the prior pullback to fresh yearly lows near 1.1320. Meanwhile, spot remains on the back foot as the US Dollar continues to draw support from hawkish Fed expectations and uncertainty over the outcome of US-Iran peace negotiations.

Gold pressured near fresh 2026 lows

Gold accelerates its decline and gyrates around the key $4,000 mark per troy ounce on Wednesday, its lowest level since November 2025. In the meantime, tighter-for-longer Fed expectations and a broadly firmer US Dollar continue to weigh on the yellow metal, while uncertainty surrounding a potential US-Iran peace agreement has done little to revive demand for the safe haven space.

Crypto Today: Bitcoin, Ethereum, XRP trade under pressure as September Fed rate-hike odds increase

Bitcoin is trading between $62,000 and $63,000 at the time of writing on Wednesday, weighed down by headwinds stemming from macroeconomic uncertainty and geopolitical tensions in the Middle East.

US-Iran talks: The next 60 days will decide where Oil prices go next
Oil markets received some encouraging news after weeks of rising tensions in the Middle East. But let’s not get ahead of ourselves: we’re far from victory, and markets just seem to have priced out the worst-case scenario. The US and Iran have reportedly made "substantive progress" in talks in Switzerland and agreed on a framework for working toward a broader deal within 60 days.
Regime change: Inside Kevin Warsh's first move to make the Fed unreadable on purpose

The rate did not move. That was the least interesting thing about Kevin Warsh's first meeting in charge of the Fed. The FOMC held its benchmark at 3.50%-3.75% for the fourth straight meeting, exactly as priced, and then the new chair used his first press conference to dismantle the machinery the market has leaned on for a decade.

EUR/USD Price Analysis: Cable plunges below the 1.0500 level