EUR/USD dips to fresh monthly lows sub-1.1700 as market sentiment sours
- EUR/USD extends losses below 1.1700 and drops nearly 1% in the last three days.
- Mixed Eurozone PMI data have failed to provide support to the Euro.
- The closure of the Strait of Hormuz keeps pushing Oil prices higher, clouding the Eurozone's economic outlook.

The Euro (EUR) extends losses against the US Dollar (USD) for the third consecutive day on Thursday, reaching its lowest levels since April 13, at the 1.1680 area. The stagnated US-Iran peace process is undermining investors' sentiment, while, in the Eurozone, business activity data has disappointed, adding pressure on the Euro.
The Eurozone preliminary HCOB Purchasing Managers’ Index (PMI) has shown an unexpected improvement in the manufacturing sector, which has jumped to its highest level in nearly 4 years, at 52.2, from 51.6 in March, beating expectations of a slight pullback to 50.8.
Services activity, on the other hand, has contracted at a 47.4 pace from 50.2 in March, below market expectations of a 49.8 reading. These figures have offset the improvement of manufacturing activity, sending the composite index down to 48.6 from 50.7 in the previous month, also below the 50.2 anticipated by the market’s consensus.
Meanwhile, the closure of the Strait of Hormuz keeps pushing Oil prices higher, and adding pressure to Crude-importing economies like those in the Eurozone. Iran seized two ships on Wednesday, and the US military redirected three Iranian tankers in Asian waters in a tit-for-tat dynamic that is straining an already tense ceasefire.
Later on Thursday, the US weekly Jobless Claims, which are expected to show a moderate pickup in new unemployment benefit recipients, are likely to provide some distraction from the geopolitical scene ahead of the preliminary US S&P Global PMI figures for April.
Technical Analysis: EUR/USD pierces the bullish trendline support
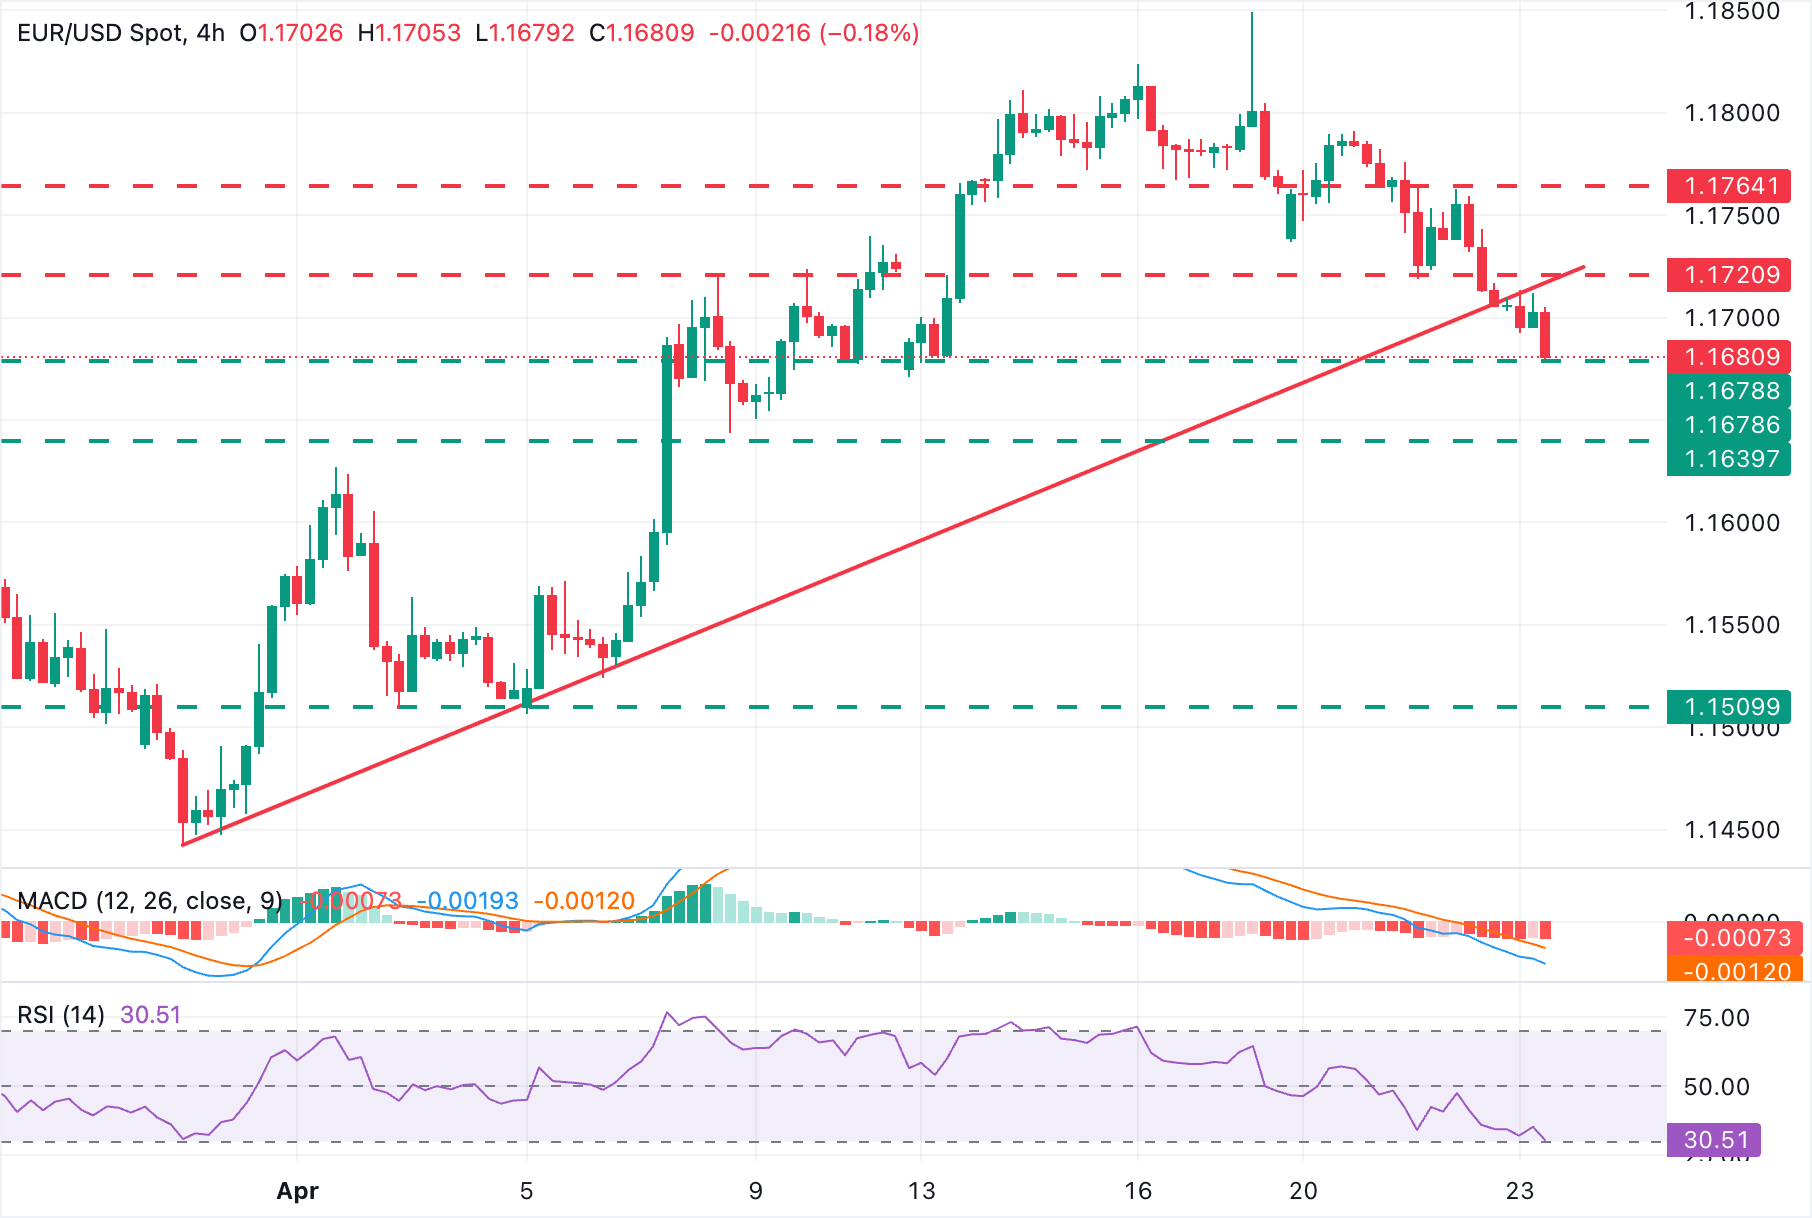
EUR/USD has broken the upward trendline from late-March lows and is depreciating further. Momentum studies show a growing negative pressure, with the Relative Strength Index (RSI) approaching oversold levels and the Moving Average Convergence Divergence (MACD) histogram showing widening red bars.
Bears are now testing support at the April 13 lows, around 1.1680, ahead of the April 8 low, at 1.1643. Further down, the area between 1.1505 and 1.1525, which held downside attempts in early April, emerges as the next target.
On the upside, the reverse trendline, which meets Tuesday's lows around 1.1720, is likely to challenge bullish reactions. A confirmation above that area would ease bearish pressure and bring Wednesday's highs, around 1.1765, back into focus.
(The technical analysis of this story was written with the help of an AI tool.)
Economic Indicator
Initial Jobless Claims
The Initial Jobless Claims released by the US Department of Labor is a measure of the number of people filing first-time claims for state unemployment insurance. A larger-than-expected number indicates weakness in the US labor market, reflects negatively on the US economy, and is negative for the US Dollar (USD). On the other hand, a decreasing number should be taken as bullish for the USD.
Read more.Last release: Thu Apr 16, 2026 12:30
Frequency: Weekly
Actual: 207K
Consensus: 215K
Previous: 219K
Source: US Department of Labor
Every Thursday, the US Department of Labor publishes the number of previous week’s initial claims for unemployment benefits in the US. Since this reading could be highly volatile, investors may pay closer attention to the four-week average. A downtrend is seen as a sign of an improving labour market and could have a positive impact on the USD’s performance against its rivals and vice versa.
Economic Indicator
S&P Global Manufacturing PMI
The S&P Global Manufacturing Purchasing Managers Index (PMI), released on a monthly basis, is a leading indicator gauging business activity in the US manufacturing sector. The data is derived from surveys of senior executives at private-sector companies from the manufacturing sector. Survey responses reflect the change, if any, in the current month compared to the previous month and can anticipate changing trends in official data series such as Gross Domestic Product (GDP), industrial production, employment and inflation. A reading above 50 indicates that the manufacturing economy is generally expanding, a bullish sign for the US Dollar (USD). Meanwhile, a reading below 50 signals that activity in the manufacturing sector is generally declining, which is seen as bearish for USD.
Read more.Last release: Wed Apr 01, 2026 13:45
Frequency: Monthly
Actual: 52.3
Consensus: 52.4
Previous: 52.4
Source: S&P Global
Economic Indicator
S&P Global Services PMI
The S&P Global Services Purchasing Managers Index (PMI), released on a monthly basis, is a leading indicator gauging business activity in the US services sector. As the services sector dominates a large part of the economy, the Services PMI is an important indicator gauging the state of overall economic conditions. The data is derived from surveys of senior executives at private-sector companies from the services sector. Survey responses reflect the change, if any, in the current month compared to the previous month and can anticipate changing trends in official data series such as Gross Domestic Product (GDP), industrial production, employment and inflation. A reading above 50 indicates that the services economy is generally expanding, a bullish sign for the US Dollar (USD). Meanwhile, a reading below 50 signals that activity among service providers is generally declining, which is seen as bearish for USD.
Read more.Last release: Fri Apr 03, 2026 13:45
Frequency: Monthly
Actual: 49.8
Consensus: 51.1
Previous: 51.1
Source: S&P Global
Author

Guillermo Alcala
FXStreet
Graduated in Communication Sciences at the Universidad del Pais Vasco and Universiteit van Amsterdam, Guillermo has been working as financial news editor and copywriter in diverse Forex-related firms, like FXStreet and Kantox.