EUR/GBP Technical Analysis: Euro losing steam against GBP as 0.9000 figure caps advances

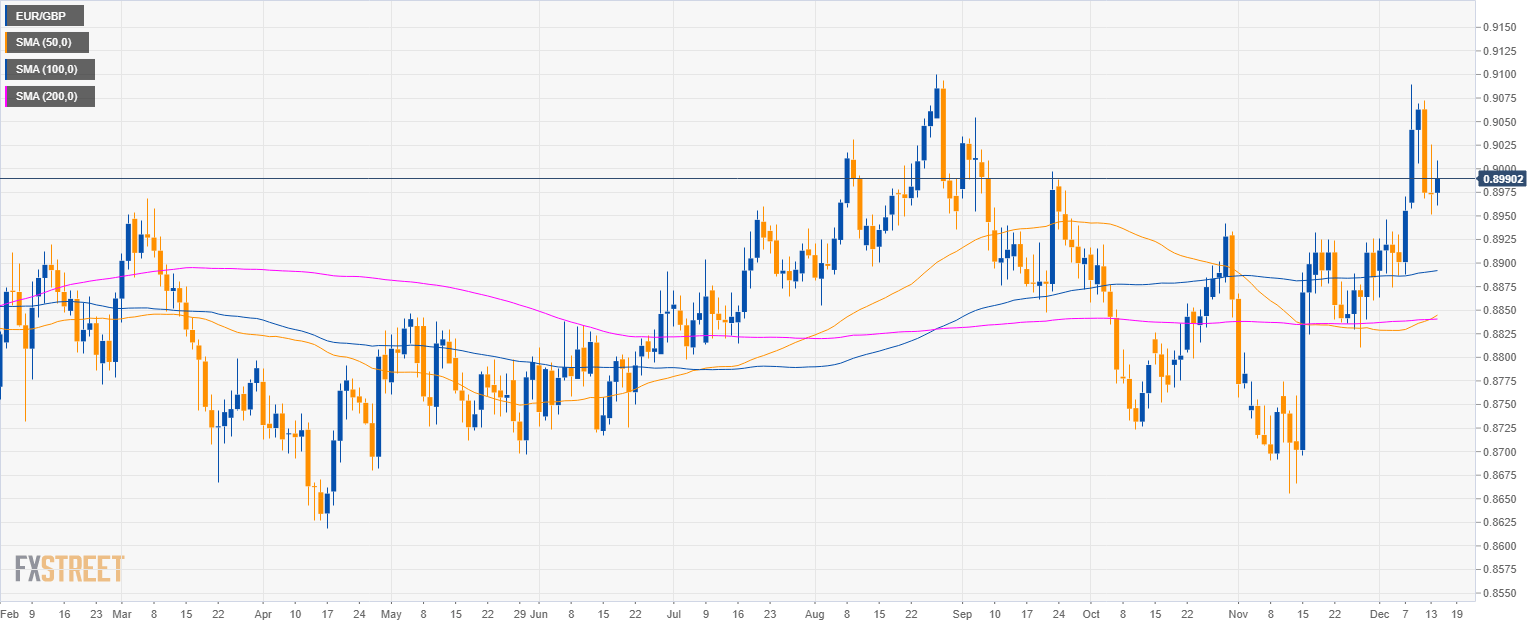
EUR/GBP daily chart
- EUR/GBP is trading in a bull trend above flat 50, 100 and 200-day simple moving averages.
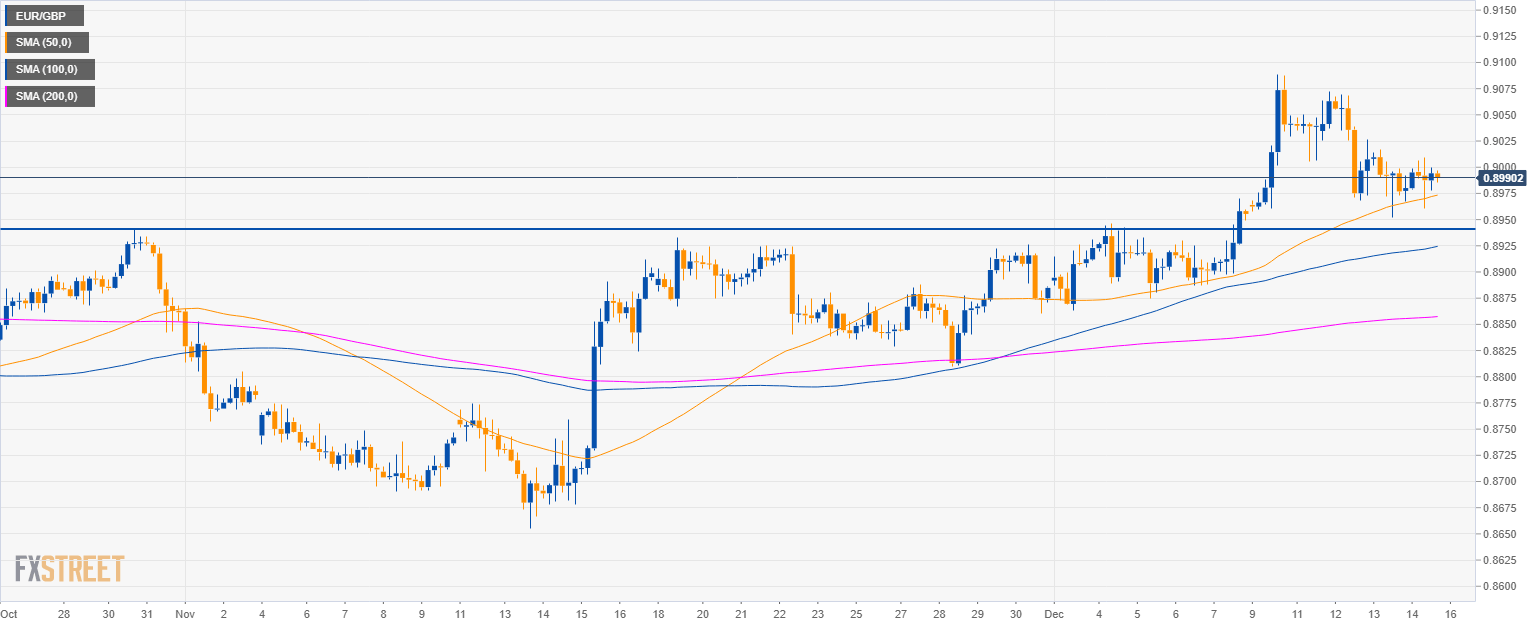
EUR/GBP 4-hour chart
- EUR/GBP is testing the 50 SMA.
- EUR/GBP is now trading just below the 0.9000 psychological level.
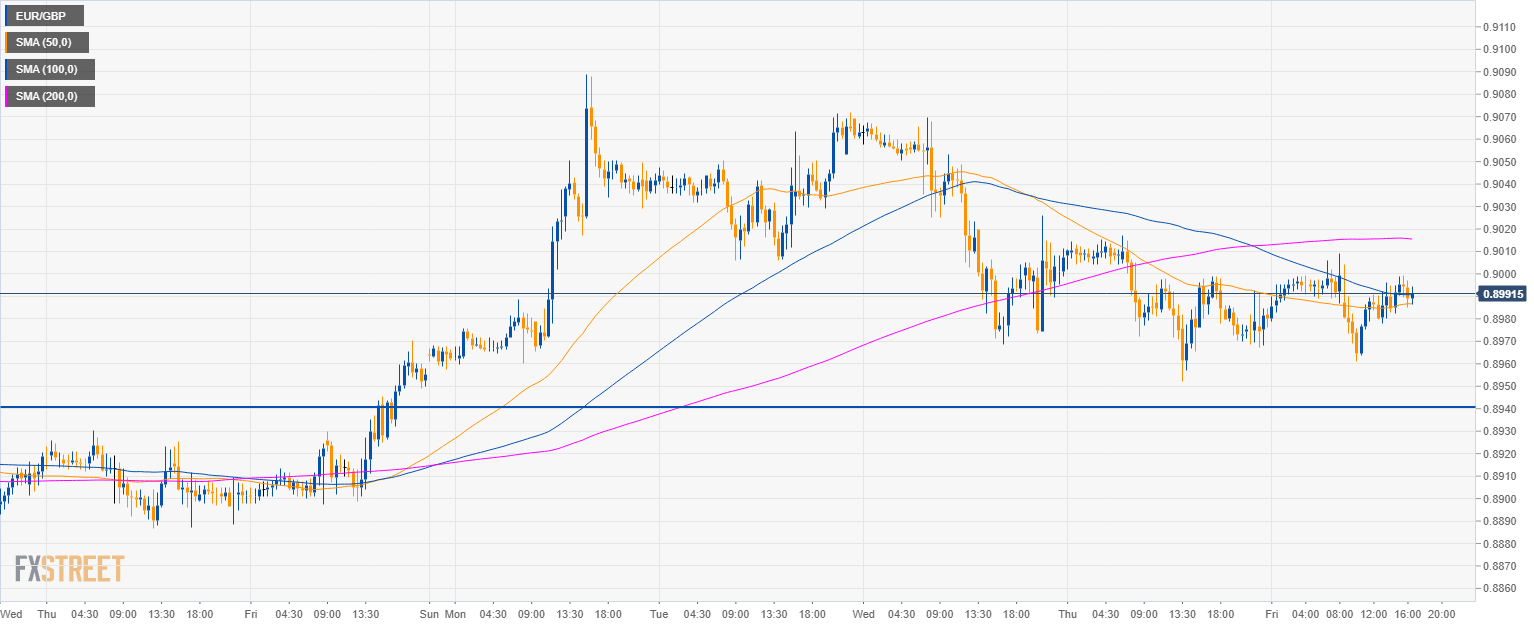
EUR/GBP 30-minute chart
- EUR/GBP is trading below the 200 SMA.
- EUR/GBP is losing steam and a dip to 0.8940 is the most likely outcome in the short-term.
Additional key levels
EUR/GBP
Overview:
Today Last Price: 0.8989
Today Daily change: 16 pips
Today Daily change %: 0.178%
Today Daily Open: 0.8973
Trends:
Previous Daily SMA20: 0.8917
Previous Daily SMA50: 0.8841
Previous Daily SMA100: 0.8891
Previous Daily SMA200: 0.8841
Levels:
Previous Daily High: 0.9026
Previous Daily Low: 0.8952
Previous Weekly High: 0.897
Previous Weekly Low: 0.8863
Previous Monthly High: 0.8932
Previous Monthly Low: 0.8656
Previous Daily Fibonacci 38.2%: 0.898
Previous Daily Fibonacci 61.8%: 0.8998
Previous Daily Pivot Point S1: 0.8941
Previous Daily Pivot Point S2: 0.891
Previous Daily Pivot Point S3: 0.8867
Previous Daily Pivot Point R1: 0.9015
Previous Daily Pivot Point R2: 0.9058
Previous Daily Pivot Point R3: 0.9089
Author

Flavio Tosti
Independent Analyst


