EUR/GBP Technical Analysis: Euro bulls looking at 0.9000 target next week against the British Pound

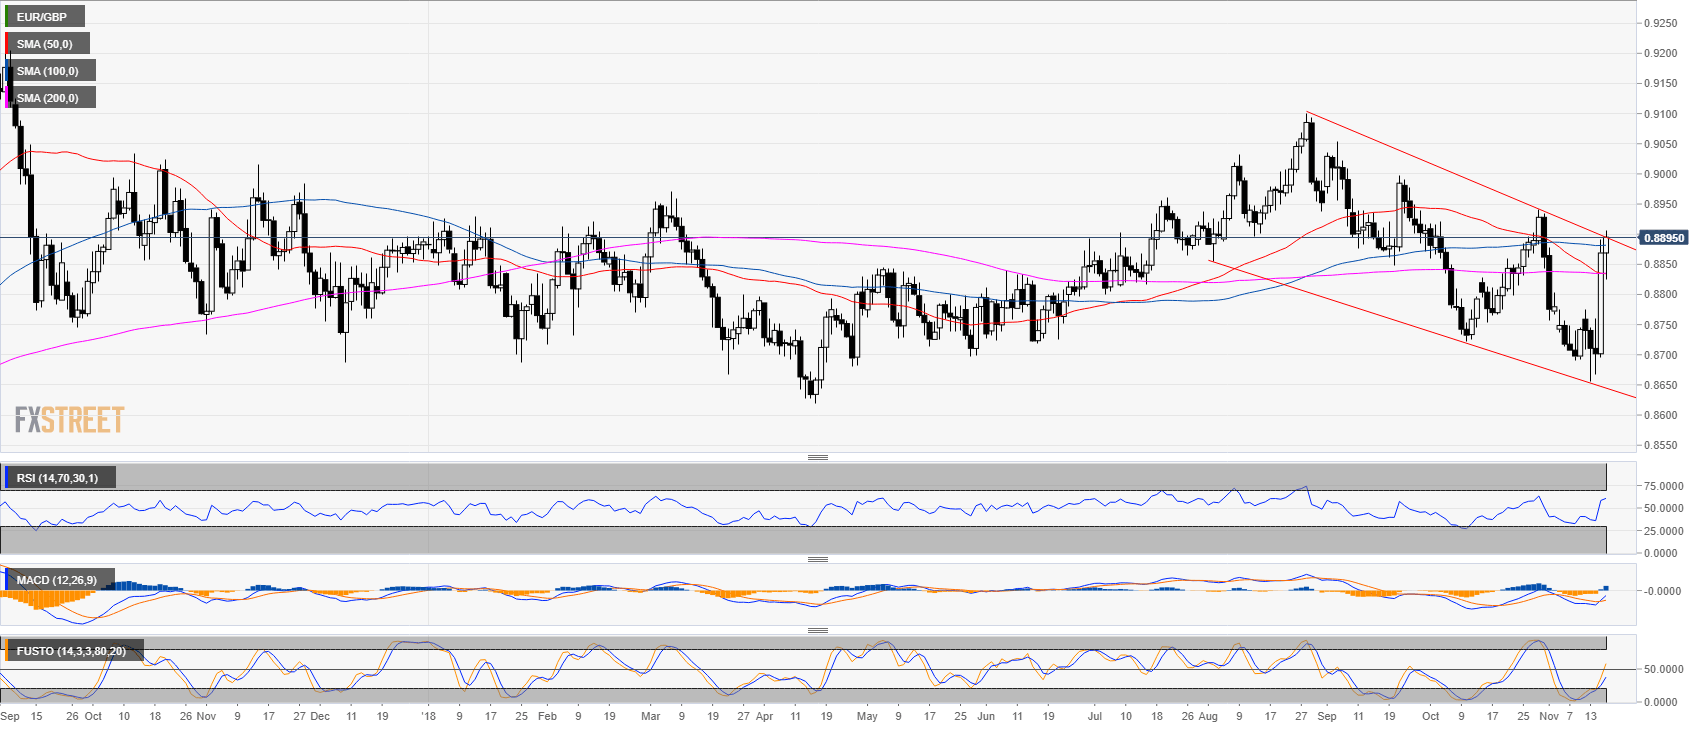
EUR/GBP daily chart
- EUR/GBP is trading at the top of the bear channel as it broke above all the main simple moving averages (SMA).
- Technical indicators such as RSI is above 50 while the MACD crossed over from below.
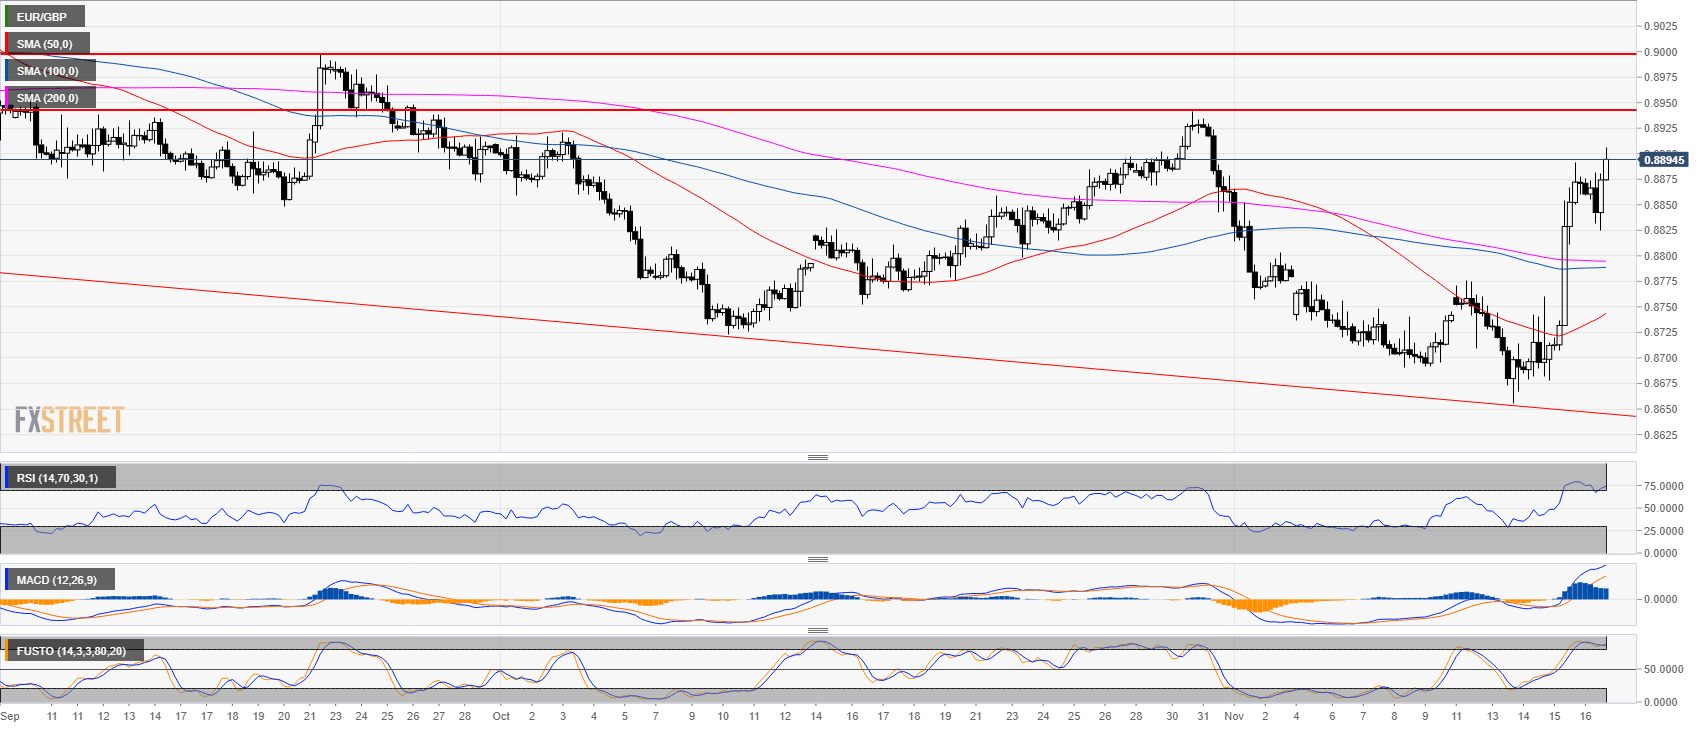
EUR/GBP 4-hour chart
- The next objective for bulls is to reach 0.8941 (October high) followed by 0.8997 (Sept. 21 high).
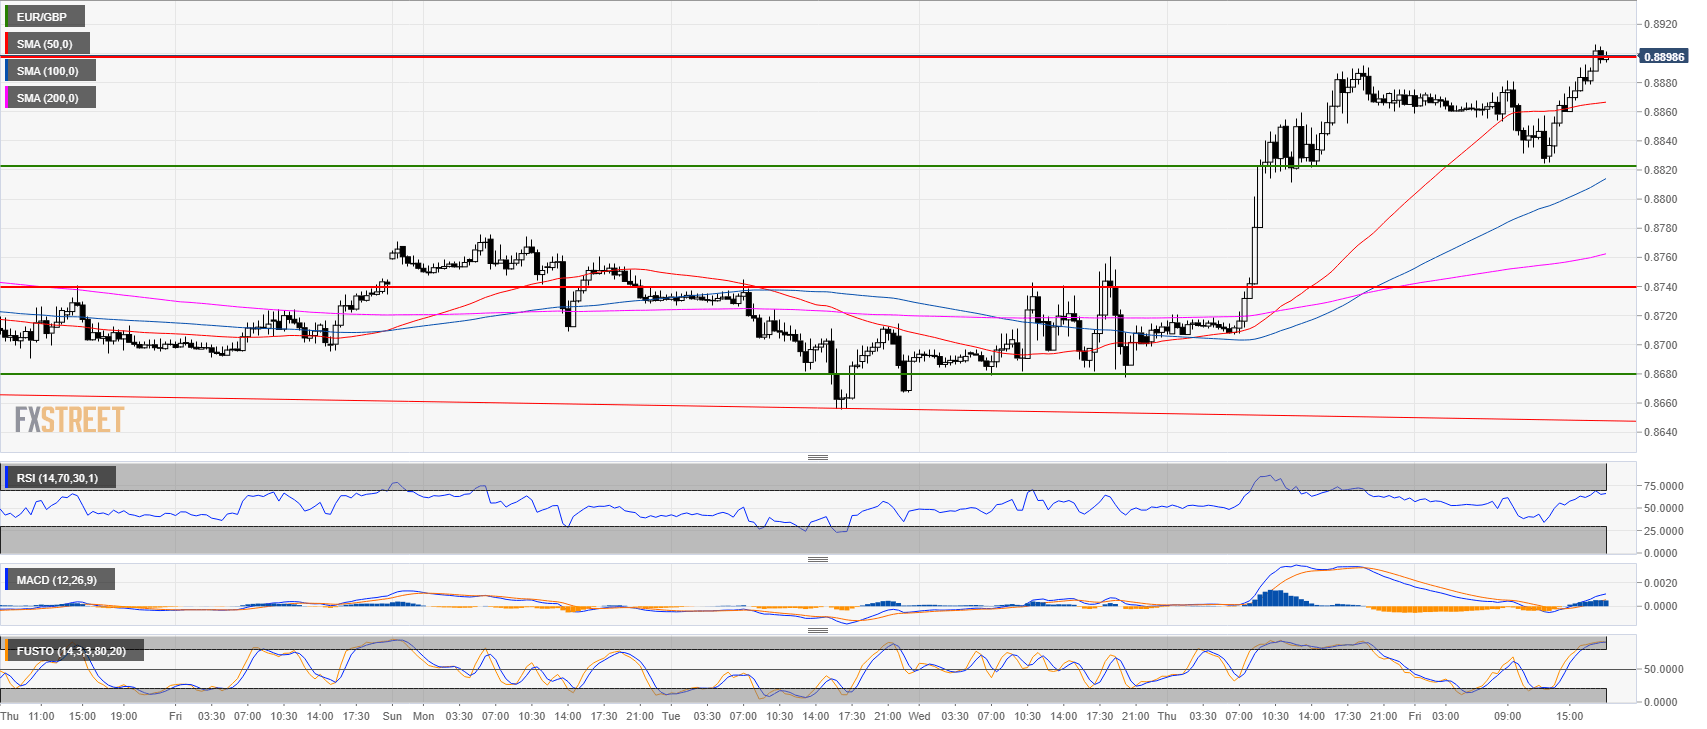
EUR/GBP 30-minute chart
- In the meanwhile, the level to beat for bulls is the 0.8900 resistance.
- A break below 0.8820 can be a sign of bullish weakness.
Additional key levels at a glance:
EUR/GBP
Overview:
Last Price: 0.8897
Daily change: 28 pips
Daily change: 0.316%
Daily Open: 0.8869
Trends:
Daily SMA20: 0.8798
Daily SMA50: 0.8835
Daily SMA100: 0.8881
Daily SMA200: 0.8835
Levels:
Daily High: 0.8892
Daily Low: 0.8696
Weekly High: 0.8774
Weekly Low: 0.869
Monthly High: 0.8942
Monthly Low: 0.8722
Daily Fibonacci 38.2%: 0.8817
Daily Fibonacci 61.8%: 0.8771
Daily Pivot Point S1: 0.8746
Daily Pivot Point S2: 0.8623
Daily Pivot Point S3: 0.8551
Daily Pivot Point R1: 0.8942
Daily Pivot Point R2: 0.9014
Daily Pivot Point R3: 0.9137
Author

Flavio Tosti
Independent Analyst


