|

EUR/GBP Price Analysis: Struggles at 0.8700, prints two-month high as ECB meeting looms

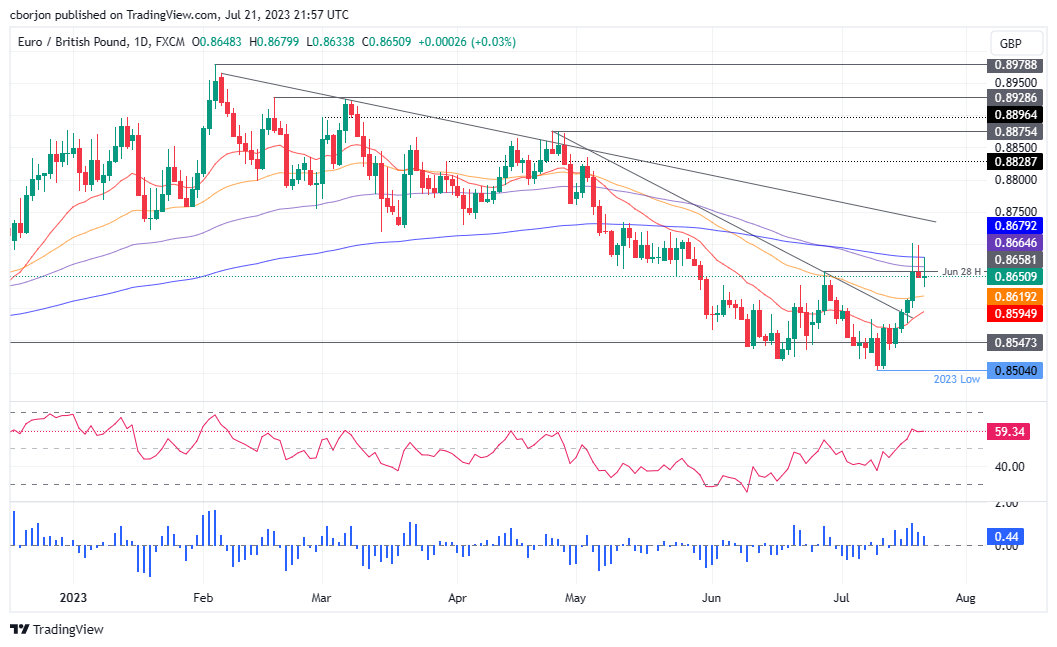
  • EUR/GBP fails to decisively break above the 100 and 200-day EMAs at 0.8664 and 0.8679, respectively, after hitting a two-month high at 0.8700.
  • If EUR/GBP pulls back, support levels emerge at 50-day EMA at 0.8619, 0.8600, 20-day EMA at 0.8594, and July 10 high at 0.8584.
  • A break above 0.8700 will set sights on the next resistance at the May 11 high of 0.8734, followed by the resistance trendline from the YTD high at 0.8978 around 0.8740/50.

The EUR/GBP finished Friday’s session almost flat, failing to decisively break above the 100 and 200-day Exponential Moving Averages (EMAs), each at  0.8664 and 0.8679, respectively after the cross hit a new two-month high at 0.8700. As we head into the weekend, the EUR/GBP is trading at 0.8650, gains 0.03%.

EUR/GBP Price Analysis: Technical outlook

With EUR/GBP remaining unable to breach the 0.8700 figure, the Euro (EUR) remains exposed to selling pressure, but the next week’s upcoming monetary policy meeting of the European Central Bank (ECB) could lend a lifeline to hover around the current exchange rate, as it happened on Thursday and Friday.

If EUR/GBP pullbacks, the first support would be the 50-day EMA at 0.8619, followed by the 0.8600 mark. If the cross extends its drop past those two levels, it’s almost certain that it would drop past the 0-day EMA at 0.8594, with sellers eying the July 10 high at 0.8584, followed by the year-to-date (YTD) low of 0.8504.

Conversely, if EUR/GBP breaks above 0.8700, the EUR/GBP's next resistance level would be the May 11 high at 0.8734, followed by a resistance trendline drawn from the YTD high at 0.8978 that passes at around 0.8740/50. A breach of the latter will expose the 0.8800 mark.

EUR/GBP Price Action – Daily chart

EUR/GBP Daily chart

EUR/GBP

Overview
Today last price0.8657
Today Daily Change0.0007
Today Daily Change %0.08
Today daily open0.865
 
Trends
Daily SMA200.8582
Daily SMA500.8607
Daily SMA1000.8704
Daily SMA2000.873
 
Levels
Previous Daily High0.8698
Previous Daily Low0.8649
Previous Weekly High0.8584
Previous Weekly Low0.8504
Previous Monthly High0.8658
Previous Monthly Low0.8518
Daily Fibonacci 38.2%0.8668
Daily Fibonacci 61.8%0.8679
Daily Pivot Point S10.8633
Daily Pivot Point S20.8616
Daily Pivot Point S30.8583
Daily Pivot Point R10.8683
Daily Pivot Point R20.8715
Daily Pivot Point R30.8732

Author

Christian Borjon Valencia

Christian Borjon began his career as a retail trader in 2010, mainly focused on technical analysis and strategies around it. He started as a swing trader, as he used to work in another industry unrelated to the financial markets.

More from Christian Borjon Valencia
Share:

Markets move fast. We move first.

Orange Juice Newsletter brings you expert driven insights - not headlines. Every day on your inbox.

By subscribing you agree to our Terms and conditions.

Editor's Picks

EUR/USD moves sideways below 1.1800 on Christmas Eve

EUR/USD struggles to find direction and trades in a narrow channel below 1.1800 after posting gains for two consecutive days. Bond and stock markets in the US will open at the usual time and close early on Christmas Eve, allowing the trading action to remain subdued. 

GBP/USD keeps range around 1.3500 amid quiet markets

GBP/USD keeps its range trade intact at around 1.3500 on Wednesday. The Pound Sterling holds the upper hand over the US Dollar amid pre-Christmas light trading as traders move to the sidelines heading into the holiday season. 

Gold retreats from record highs, trades below $4,500

Gold retreats after setting a new record-high above $4,520 earlier in the day and trades in a tight range below $4,500 as trading volumes thin out ahead of the Christmas break. The US Dollar selling bias remains unabated on the back of dovish Fed expectations, which continues to act as a tailwind for the bullion amid persistent geopolitical risks.

Bitcoin slips below $87,000 as ETF outflows intensify, whale participation declines

Bitcoin price continues to trade around $86,770 on Wednesday, after failing to break above the $90,000 resistance. US-listed spot ETFs record an outflow of $188.64 million on Tuesday, marking the fourth consecutive day of withdrawals.

Economic outlook 2026-2027 in advanced countries: Solidity test

After a year marked by global economic resilience and ending on a note of optimism, 2026 looks promising and could be a year of solid economic performance. In our baseline scenario, we expect most of the supportive factors at work in 2025 to continue to play a role in 2026.

Avalanche struggles near $12 as Grayscale files updated form for ETF

Avalanche trades close to $12 by press time on Wednesday, extending the nearly 2% drop from the previous day. Grayscale filed an updated form to convert its Avalanche-focused Trust into an ETF with the US Securities and Exchange Commission.