|

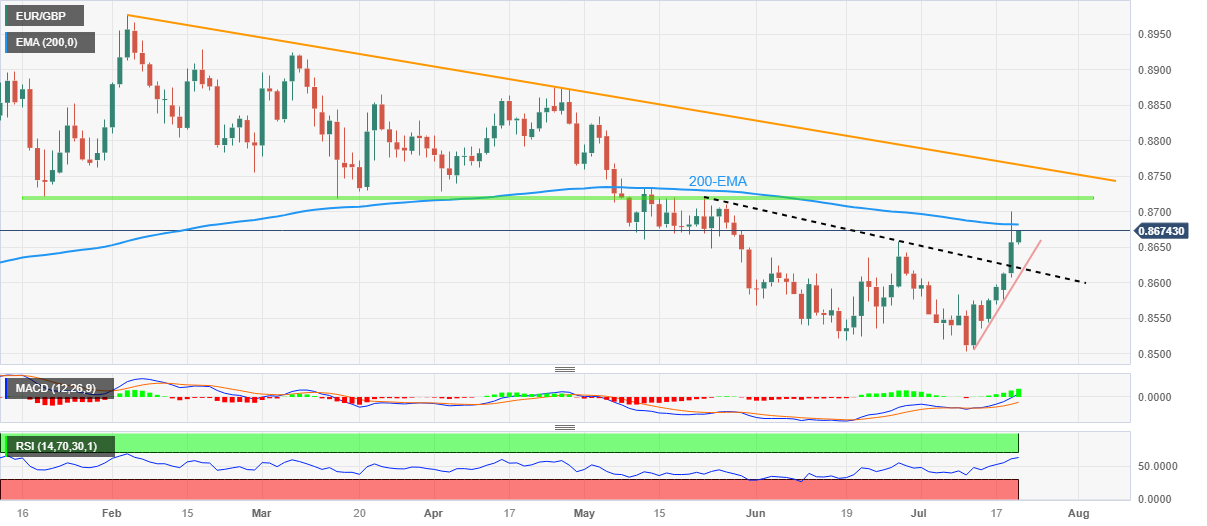
EUR/GBP Price Analysis: Justifies nearby resistance break to approach 200-EMA below 0.8700

  • EUR/GBP prints five-day winning streak despite retreat from two-month high the previous day.
  • Clear break of multi-day-old resistance line, bullish MACD signals favor pair buyers.
  • Nearly overbought RSI highlights 200-EMA, six-month-old horizontal area the key hurdles toward the north.

EUR/GBP bulls occupy the driver’s seat around 0.8670, up for the fifth consecutive day heading into Thursday’s London open. In doing so, the cross-currency pair justifies the previous day’s upside break of an eight-week-old descending trend line by reversing the retreat from its highest level since late May, marked on Wednesday.

Apart from the trend line breakout, bullish MACD signals also enable the EUR/GBP buyers to keep the reins.

However, the RSI (14) line appears nearly overbought and hence the 200-Exponential Moving Average (EMA) hurdle surrounding 0.8685 may again prod the pair buyers.

If the EUR/GBP manages to remain firmer past 0.8685, a horizontal area comprising multiple levels marked since January and a five-month-old descending resistance line, respectively near 0.8720 and 0.8765, will be in the spotlight.

Alternatively, the EUR/GBP pullback remains elusive unless the quote provides a daily closing beneath the resistance-turned-support line, close to 0.8620 at the latest.

It’s worth noting that a one-week-long rising support line surrounding 0.8610 and the 0.8600 round figure could challenge the pair sellers past 0.8620 before giving them control.

EUR/GBP: Daily chart
Trend: Limited upside expected

Additional important levels

Overview
Today last price0.867
Today Daily Change0.0013
Today Daily Change %0.15%
Today daily open0.8657
 
Trends
Daily SMA200.8579
Daily SMA500.8609
Daily SMA1000.8706
Daily SMA2000.873
 
Levels
Previous Daily High0.8701
Previous Daily Low0.8608
Previous Weekly High0.8584
Previous Weekly Low0.8504
Previous Monthly High0.8658
Previous Monthly Low0.8518
Daily Fibonacci 38.2%0.8665
Daily Fibonacci 61.8%0.8643
Daily Pivot Point S10.8609
Daily Pivot Point S20.8562
Daily Pivot Point S30.8516
Daily Pivot Point R10.8703
Daily Pivot Point R20.8749
Daily Pivot Point R30.8797

Author

Anil Panchal

Anil Panchal

FXStreet

Anil Panchal has nearly 15 years of experience in tracking financial markets. With a keen interest in macroeconomics, Anil aptly tracks global news/updates and stays well-informed about the global financial moves and their implications.


More from Anil Panchal
Share:

Editor's Picks

AUD/USD falters just above 0.7000; looks at the jobs data

AUD/USD has briefly managed to surpass the 0.7000 threshold on Wednesday, although the move rapidly dissipated following higher-than-estimated US inflation data in September, which has eventually lent extra legs to the Greenback. Moving forward, the release of the labour market report will take centre stage in Australia on Thursday.

USD/JPY consolidates near 158.50; looks to US CPI for fresh impetus

USD/JPY stays range-bound near 158.50 in the Asian session on Wednesday, with looming intervention risks supporting the Japanese Yen and capping upside amid a softer US Dollar. However, geopolitical uncertainties act as a tailwind for the safe-haven USD and the pair. Traders also seem hesitant ahead of the release of the latest US inflation figures.

Gold remains offered below $4,100

Gold adds to the weekly bearish tone and slips back below the $4,100 mark per troy ounce on Wednesday. Indeed, the precious metal continues to suffer the stronger US Dollar and rising US Treasury yields as bets for extra tightening by the Fed remain on the rise following US inflation figures.

Bitcoin and Gold Forecast: BTC and XAU drop after hot US CPI
Bitcoin (BTC) is edging lower toward $82,000 on Wednesday as headwinds from sticky inflation in the United States (US) force investors to reevaluate their positioning. Gold (XAU/USD) remains under sustained selling pressure, trading below $4,100 and falling for a third consecutive day. As the correction intensifies, a retest of key $4,000 support appears likely unless bearish momentum abates.
Stock futures just went red on the CPI. Here's what the bond market is pricing that equities haven't caught up to
Since late June, the bond market has been pricing in a Federal Reserve (Fed) that keeps raising rates into 2027, and most US stocks have already been marked down for it. The S&P 500 hasn't, because a handful of AI-linked giants make up much of the index and their prices haven't followed the rest.
Has Bitcoin really escaped the macro forces it was built to fight?
Over 17 years ago, Satoshi Nakamoto designed Bitcoin (BTC) on the back of a global financial crisis as an alternative to the global monetary system outside the control of central banks, governments and traditional intermediaries. This raises a key question: has Bitcoin really become independent of the macroeconomic forces it was built to challenge?