|

EUR/CHF Price Analysis: Double Bottom reversal activates as Credit Suisse’s fiasco continues

  • EUR/CHF is demonstrating a back-and-forth action around 0.9860 ahead of ECB policy.
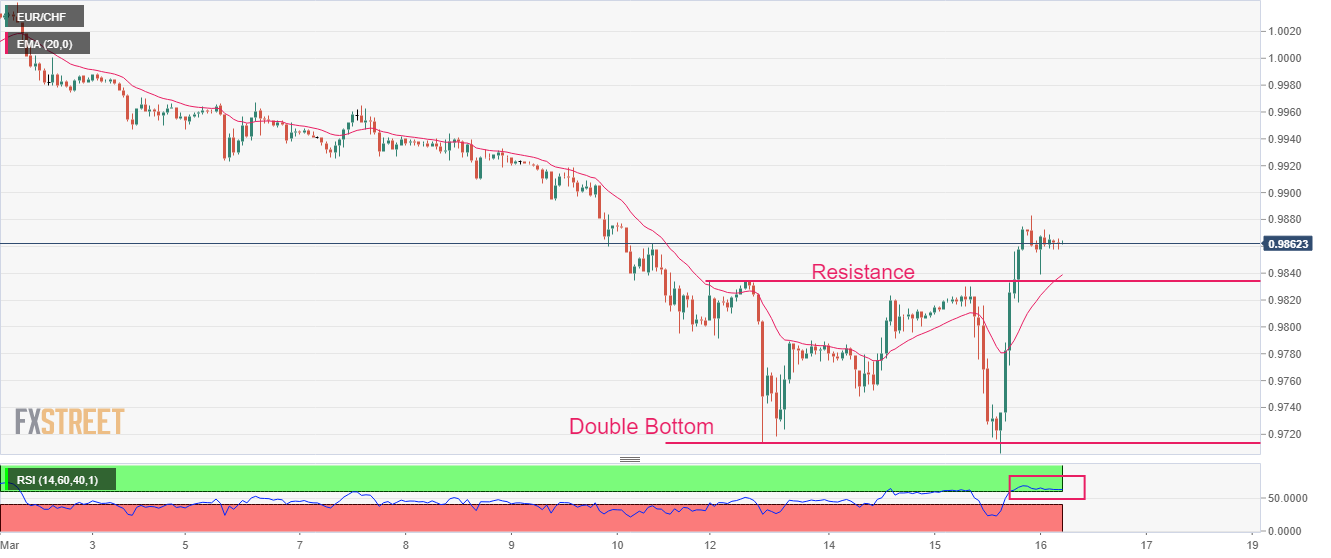
  • A Double Bottom pattern has activated after a breakout of critical resistance placed at 0.9834.
  • The RSI (14) is oscillating in the bullish range of 60.00-80.00, which indicates more upside ahead.

The EUR/CHF pair is displaying a back-and-forth action around 0.9860 in the early European session. The cross has turned sideways after a perpendicular upside move and is expected to continue its upside momentum as the debacle of Credit Suisse is stretching further.

The Swiss National Bank (SNB) has promised an advance of 50bln Swiss Francs to Credit Suisse to support liquidity. However, the commentary from Credit Suisse chairman Axel Lehmann that state assistance "isn't a topic" for the bank as it seeks to recover from a string of scandals that have undermined the confidence of investors and clients indicates that the impact will be huge going forward.

Meanwhile, investors are keenly awaiting the interest rate decision by the European Central Bank (ECB). ECB President Christine Lagarde is expected to continue its 50 basis points (bps) rate hike spell as Eurozone’s inflation is extremely stubborn.

EUR/CHF has delivered a break above the critical resistance plotted from March 13 high at 0.9834 on an hourly scale. This has activated the formation of a Double Bottom chart pattern and has cemented a bullish reversal.

The 20-period Exponential Moving Average (EMA) at 0.9839 might continue to provide support to the Euro bulls.

Meanwhile, the Relative Strength Index (RSI) (14) is oscillating in the bullish range of 60.00-80.00, which indicates more upside ahead.

Should the asset delivers a mean-reversion to the 20-EMA near 0.9839, a bargain buying opportunity will be triggered, which will drive the cross toward the round-level resistance at 0.9900, followed by October 27 high at 0.9955.

In an alternate scenario, a downside break below March 15 low at 0.9706 will drag the asset toward October 12 low at 0.9643 and September 13 low at 0.9584.

EUR/CHF hourly chart
EUR/CHF

Overview
Today last price0.9862
Today Daily Change-0.0010
Today Daily Change %-0.10
Today daily open0.9872
 
Trends
Daily SMA200.9901
Daily SMA500.9932
Daily SMA1000.9895
Daily SMA2000.9856
 
Levels
Previous Daily High0.9875
Previous Daily Low0.9706
Previous Weekly High0.9967
Previous Weekly Low0.9795
Previous Monthly High1.0033
Previous Monthly Low0.9847
Daily Fibonacci 38.2%0.9811
Daily Fibonacci 61.8%0.9771
Daily Pivot Point S10.976
Daily Pivot Point S20.9649
Daily Pivot Point S30.9592
Daily Pivot Point R10.993
Daily Pivot Point R20.9987
Daily Pivot Point R31.0099

Author

Sagar Dua

Sagar Dua

FXStreet

Sagar Dua is associated with the financial markets from his college days. Along with pursuing post-graduation in Commerce in 2014, he started his markets training with chart analysis.


More from Sagar Dua
Share:

Editor's Picks

AUD/USD: Recovery appears capped by 0.7000

AUD/USD has reversed a multi-day positive streak, briefly revisiting the 0.6940 region before trimming part of those gains to end the day modestly on the back foot. The better tone in the Greenback has kept the pair under pressure, which has so far met decent contention in the vicinity of the 0.6900 zone. Moving forward, the Melbourne Institute’s Consumer Inflation Expectations is next on tap in Oz.

USD/JPY holds firm near 158.50 ahead of Fed Minutes

USD/JPY hangs close to a one-and-a-half-week high near 158.50 in the Asian session on Wednesday, with bulls now awaiting a move beyond the 200-day SMA hurdle before positioning for further gains ahead of the FOMC Minutes. Meanwhile, a fresh leg up in US bond yields revives US Dollar demand amid geopolitical uncertainties, boosting the pair amid dovish BoJ commentary.

Gold trims losses, back above $4,100

Gold now manages to regain some balance, returning to the area above the key $4,100 mark per troy ounce following the closing bell in Europe on Wednesday. The yellow metal’s sharp pullback comes in tandem with marked gains in the US Dollar and a marked bounce in US Treasury yields across the curve.

Bitcoin vs Gold: BTC and XAU fall amid macro headwinds, but Ray Dalio still prefers Gold
Bitcoin (BTC) edges lower on Wednesday, trading near $83,000. The broader correction in the cryptocurrency market can be attributed to heavily leveraged long liquidations, macro and geopolitical pressure reducing risk appetite. Gold (XAU/USD), similarly, remains in bearish hands as it tests short-term support at $4,100.
Fed Minutes: Officials saw inflation risks worsening before September hike
All participants at the Federal Reserve's (Fed) September 15–16 meeting supported the 25-basis-point rate increase, while most judged that another hike would probably be appropriate by the end of the year. The Minutes show policymakers increasingly focused on upside inflation risks, a resilient economy and the possibility that strong AI investment could add to demand pressures.
The UK 30-year gilt just hit a 1998 high. Is that good or bad for the British Pound?
The yield on the UK's 30-year government bond, or gilt, went through 6% on October 1 for the first time since early 1998, and on Monday the Pound was at its strongest against the Euro since June 2025. The gilt market's 28-year high is mostly someone else's. Since early May, the 30-year gilt yield has risen about 0.15 of a percentage point and the US 30-year about 0.7.