Equities report: Amazon to invest in OpenAI, as the self-funding circle continues

US equities moved lower since last week. In today’s report we are to have a look at the recent US employment data release, the newest developments in the bidding war for Warner Bros and Amazon’s newest investment in OpenAI. We are to conclude the report with a technical analysis of S&P 500’s daily chart.
Amazon to invest in OpenAI as the AI self-funding circle continues
Amazon is apparently preparing to invest $10bn in OpenAI and sell it chips and computing power, with the deal anticipated to include OpenAI using Amazon’s Trainium series of AI chips and renting more data center capacity in order to run its models. In theory, Amazon is giving OpenAI money who will then be using that money to purchase data center capacity from Amazon and their Trainium series of AI chips, essentially returning the money back to Amazon. This appears to benefit OpenAI by essentially providing them with funding to increase their cloud capacity, whilst Amazon benefits from OpenAI using their services, so our real question is when will this stop. In our view, Amazon is essentially giving OpenAI money in return for OpenAI to use Amazon’s cloud computing storage and AI chips, so essentially giving back a portion of the deal. Overall, the true winner here may be Amazon who may see increased artificial demand for their AI chips and cloud services, whilst receiving feedback and data from OpenAI. On a personal level, this analyst begs to ask the question as to when this circular investment cycle will stop, as a failure to produce tangible returns and results in the coming year after so much investment could lead to the dominoes falling, possibly unravelling the AI bubble.
Mixed employment data
We highlight the US’s employment data for November which was released yesterday.The data showed that the labour market remained soft, leaving investors on edge about when the next rate cut from the Federal Reserve may occur. While the U.S. economy added 64,000 jobs in November, surpassing an estimate from economists polled by Reuters, the unemployment rate ticked upwards from 4.4% to 4.6% which may be the bigger issue here, as even though the NFP figure exceeded expectations, it is still at relatively low levels. However, the 43-day government shutdown distorted the data thus clouding the waters surrounding the actual state of the US Employment market. Nonetheless, the implications of a loosening labour market could increase pressure on the Fed to remain on their rate cutting path, thus easing the financial conditions surrounding the US economy, which in turn could aid the US Equities markets. Yet, we should note that the US CPI rates for November are due out tomorrow and could change the narrative and thus could weigh on the US stockmarkets should the data showcase an acceleration of inflationary pressures and vice versa.
Warner Bros to recommend to investors to reject Paramount’s offer and accept Netflix’s
According to Bloomberg, Warner Bros is planning to reject Paramounts takeover bid, citing concerns about financing an other terms. In particular, Warner Bros Board will urge stakeholders to reject the tender offer, as the board still views the company’s existing agreement with Netflix as offering greater value.Now attention turns as to whether Paramount will submit an improved bid or if the shareholders will opt for Nvidia and follow the board’s advice. Nonetheless, the possibility of Netflix being in the lead could provide support for the company’s stock price in the long run.
Technical analysis
US500 daily chart
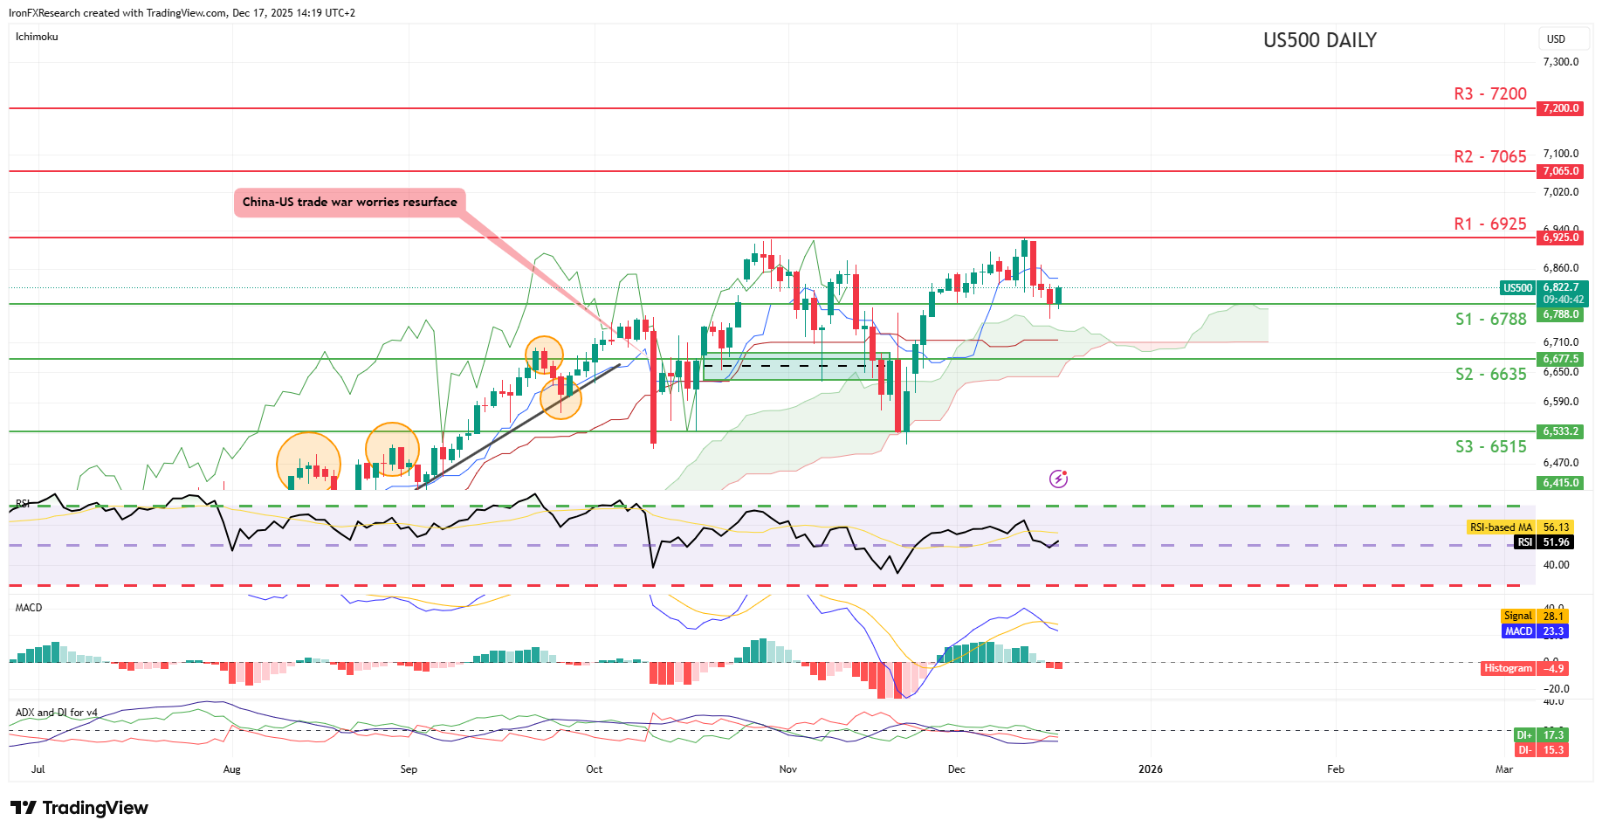
- Support: 6788 (S1), 6635 (S2), 6515 (S3).
- Resistance: 6925 (R1), 7065 (R2), 7200 (R3).
On a technical level, we note that the index appears to be moving in a sideways fashion. We opt for a sideways bias for the index and supporting our case is the RSI indicator below our chart which currently registers a figure near 50, implying a neutral market sentiment. For our sideways bias to be maintained we would require the index to remain confined between our 6788 (S1) support level and our 6925 (R1) resistance line. On the other hand, for a bullish outlook we would require a clear break above our 6925 (R1) resistance line with the next possible target for the bulls being our 7065 (R2) resistance level. Lastly, for a bearish outlook we would require a clear break below our 6788 (S1) support level with the next possible target for the bears being our 6635 (S2) support line.
Author

Phaedros Pantelides
Independent Analyst
Mr Pantelides has graduated from the University of Reading with a degree in BSc Business Economics, where he discovered his passion for trading and analyzing global geopolitics.


