|

Elliott Wave View: Nike (NKE) at potential support area [Video]

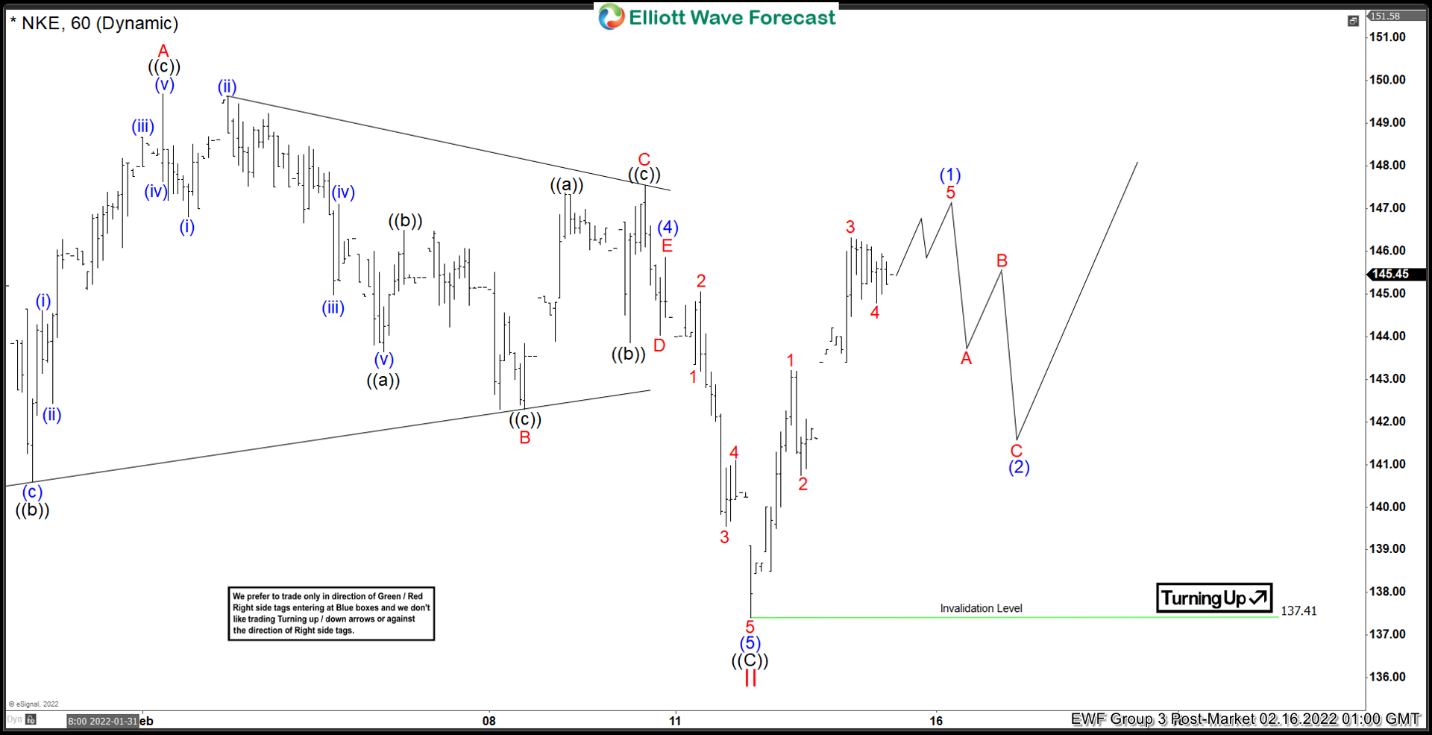
Since bottoming on March 18, 2020 low, Nike (NKE) rallied as a 5 waves into $179.10 which ended wave I on November 5, 2021 peak. Since then, the stock has corrected the cycle from March 2020 low within wave II. According to the 1 hour chart below, wave II pullback is complete at $137.41. The internal subdivision of wave II unfolded as a zigzag structure. Down from wave I, wave ((A)) ended at $155.47, rally in wave ((B)) ended at $171.19, and wave ((C)) ended at $137.41.

The stock has started to turn higher in wave III although it still needs to break above wave I at $179.10 to rule out a double correction. Up from wave II, wave 1 ended at $143.21 and pullback in wave 2 ended at $140.74. The stock resumes higher in wave 3 towards $146.32, pullback in wave 4 ended at $144.57. Expect the stock to rally 1 more leg higher to end wave 5 of (1). Afterwards, it should pullback in wave (2) to correct cycle from February 14 low before the rally resumes. Near term, as far as pivot at 137.41 low stays intact, expect pullback to find support in 3, 7, or 11 swing for further upside.

NKE 60 Minutes Elliott Wave Chart
 

Nike (NKE) Elliott Wave Video

Author

Elliott Wave Forecast Team

Elliott Wave Forecast Team

ElliottWave-Forecast.com

More from Elliott Wave Forecast Team
Share:

Editor's Picks

GBP/USD trims gains, back to around 1.3500

GBP/USD now surrenders part of the earlier move to multi-week peaks around 1.3530 and comes close to the 1.3500 support on Monday. Cable’s uptick comes in tandem with decent gains in the Greenback, always amid persistent uncertainty lingering over the reopening of the Strait of Hormuz and US-Iran talks.

EUR/USD deflates to 1.1540

EUR/USD begins the week on the back foot, retesting the 1.1540 zone as the NA session draws to a close. The better tone in the US Dollar weighs on the risk complex, sparking the daily correction in spot, always on the back of unabated effervescence in the Middle East.

Gold clings to daily gains; focus is back to $4,400

Gold picks up pace and advances past the $4,350 mark per troy ounce, adding to Friday’s gains. That said, the yellow metal keeps pushing harder despite the better tone in the US Dollar, and is closely following the Fed’s interest-rate outlook as well as developments in the Middle East

Bitcoin vs Gold Overview: XAU tests breakout, BTC slides as Trump claims Iran negotiations
The cryptocurrency market shows signs of trimming gains accrued last week as Bitcoin (BTC) slides below $65,000 at the time of writing on Monday. Meanwhile, Gold (XAU/USD) maintains a bullish outlook, hovering above $4,350.
US Payrolls miss – RBA on deck tomorrow
It would be remiss of me not to kick off this morning’s report with a rundown of last Friday’s US jobs report, which was a belter. Headline payrolls fell by 23,000, versus expectations of an 80,000 gain. The BLS noted that May was revised down by 66,000 (from 129,000) and June by 37,000 (from 57,000), resulting in combined May-June revisions of 103,000 lower than previous reports.
9-3: Is the Federal Reserve’s vote tally Warsh's new forward guidance?
The rate did not move. Neither did the statement, and that’s the more interesting fact. Set the July 29 Federal Open Market Committee (FOMC) statement beside the one issued on June 17, and the two documents are identical apart from a single verb and a paragraph at the bottom naming three dissenters.