|

Elliott Wave perspective: Nvidia’s range bound action tilts bearish [Video]

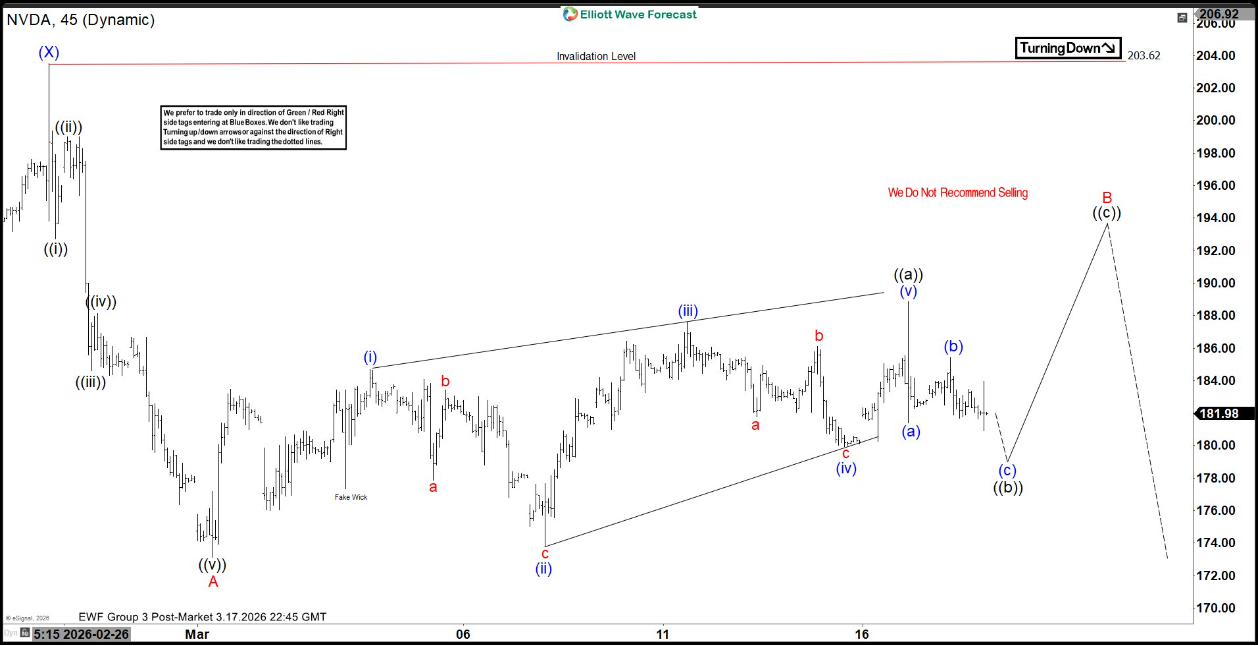
Nvidia (NVDA) has completed its cycle from the April 2025 low, and the stock is now entering a larger corrective phase. The correction is unfolding as a double three Elliott Wave structure, which often signals a complex retracement rather than a simple decline. From the all‑time high on October 29, 2025 at $212.19, wave (W) finished at $169.55. The subsequent rally in wave (X) reached $203.62, as shown in the 45‑minute chart.

Wave (Y) lower is now in progress, subdividing into a zigzag Elliott Wave structure. From the termination of wave (X), wave A ended at $173.11. The rally in wave B is developing as another zigzag, with wave ((a)) completing at $188.88. A short pullback in wave ((b)) is expected, followed by another leg higher in wave ((c)) to complete wave B.

As long as the pivot at $203.62 remains intact, Nvidia is positioned to resume its correction against the April 2025 low. The potential target for wave (Y) lies within the 100%–161.8% Fibonacci extension of wave (W). This zone, spanning $127.7 to $154.2, represents a critical area where buyers may emerge to stabilize price action. Traders should monitor the development of wave B closely, since its completion will likely set the stage for the next leg lower. The Fibonacci extension zone provides a logical area for potential support.

Nvidia (NVDA) 45-minute Elliott Wave chart

Nvidia Elliott Wave [Video]

Youtube preview

Author

Elliott Wave Forecast Team

Elliott Wave Forecast Team

ElliottWave-Forecast.com

More from Elliott Wave Forecast Team
Share:

Editor's Picks

GBP/USD loses momentum, flirts with 1.3200

GBP/USD is struggling to maintain its positive bias on Thursday, retreating toward the 1.3200 region in response to the pick in the buying interest around the Greenback. That said, Cable remains under scrutiny as cautious market sentiment keeps investors focused on the US-Iran conflict and political effervescence in the UK.

EUR/USD trims gains, challenges 1.1400

EUR/USD now gives away part of its earlier advance, receding toward the 1.1400 contention zone on Thursday. Meanwhile, the pair’s recovery comes amid extra losses in the US Dollar, at the time when while investors continue to monitor developments in the Middle East and sentiment surrounding global technology stocks.

Gold remains bid and close to $4,100

Gold accelerates its recovery and approaches the key $4,000 mark per troy ounce at the end of the week, adding to Thursday’s advance. However, expectations for a hawkish Fed remain steady and keep the yellow metal’s potential upside contained.

Crypto Today: Bitcoin at $60,000, Ethereum at $1,500, and XRP at $1 face a make-or-break test

Bitcoin (BTC), Ethereum (ETH), and Ripple (XRP) are trading in the red on Friday after three consecutive days of losses, testing their respective make-or-break support levels.

Week ahead – NFP report to challenge Dollar strength and the hawkish Fed

Dollar strength dominates markets, as the hawkish Fed overshadows geopolitics and lower oil prices. NFP week could drive September Fed hike expectations and boost market volatility. The euro lacks fresh bullish catalysts, all eyes on the preliminary inflation report and the ECB Forum.

Regime change: Inside Kevin Warsh's first move to make the Fed unreadable on purpose

The rate did not move. That was the least interesting thing about Kevin Warsh's first meeting in charge of the Fed. The FOMC held its benchmark at 3.50%-3.75% for the fourth straight meeting, exactly as priced, and then the new chair used his first press conference to dismantle the machinery the market has leaned on for a decade.