Dow Jones Industrial Average wobbles while Washington opens a toll booth in the Strait of Hormuz
- DJIA trades near 52,525, down 0.2%, after a push to 52,840 unraveled on fresh Strait of Hormuz headlines.
- Trump reinstated the naval blockade on Iranian shipping and attached a 20% levy to all cargo the United States escorts through the waterway.
- June inflation data and congressional testimony from the Federal Reserve Chair land Tuesday, with Crude Oil up more than 5% into the print.

Risk aversion set Monday's tone, and the Dow Jones Industrial Average wore it better than most of its peers; the index trades near 52,525, down 117 points or 0.2%, while the Nasdaq Composite sheds 1% and the S&P 500 gives back 0.4%. The gap between those numbers is the day's real story, and it runs straight through the Strait of Hormuz.
A blockade with a business model
The weekend supplied the escalation, and Monday supplied the invoice. Tehran attacked a commercial vessel transiting the Strait late last week, Washington answered with strikes on Iranian targets on Saturday, and Iran retaliated against United States (US) facilities across several Gulf states while declaring the waterway shut to traffic. Trump disputed the claim on Sunday, insisting the lane stays open to commercial shipping.
Monday's announcement converted that military posture into commercial policy. Trump declared on social media that the United States is reinstating what he calls the Iranian blockade, a cordon he says stops only Iranian ships and their customers, and styled America the "guardian of the Strait". As compensation for the job, Washington will collect a 20% reimbursement on all cargo it allows through. The detail lands with a certain irony, since last month's ceasefire framework explicitly barred Tehran from charging commercial ships for exactly this passage.
Crude Oil writes the discount rate
Crude Oil rendered the fastest verdict, with West Texas Intermediate (WTI) futures jumping more than 5% to trade above $75 and Brent futures rising 5.3% toward $80 per barrel. Equities read the same tape as an inflation problem wearing a geopolitical costume; a supply chokepoint with a new toll regime feeds directly into energy and goods costs at the precise moment the market wanted confirmation that disinflation was back on script.
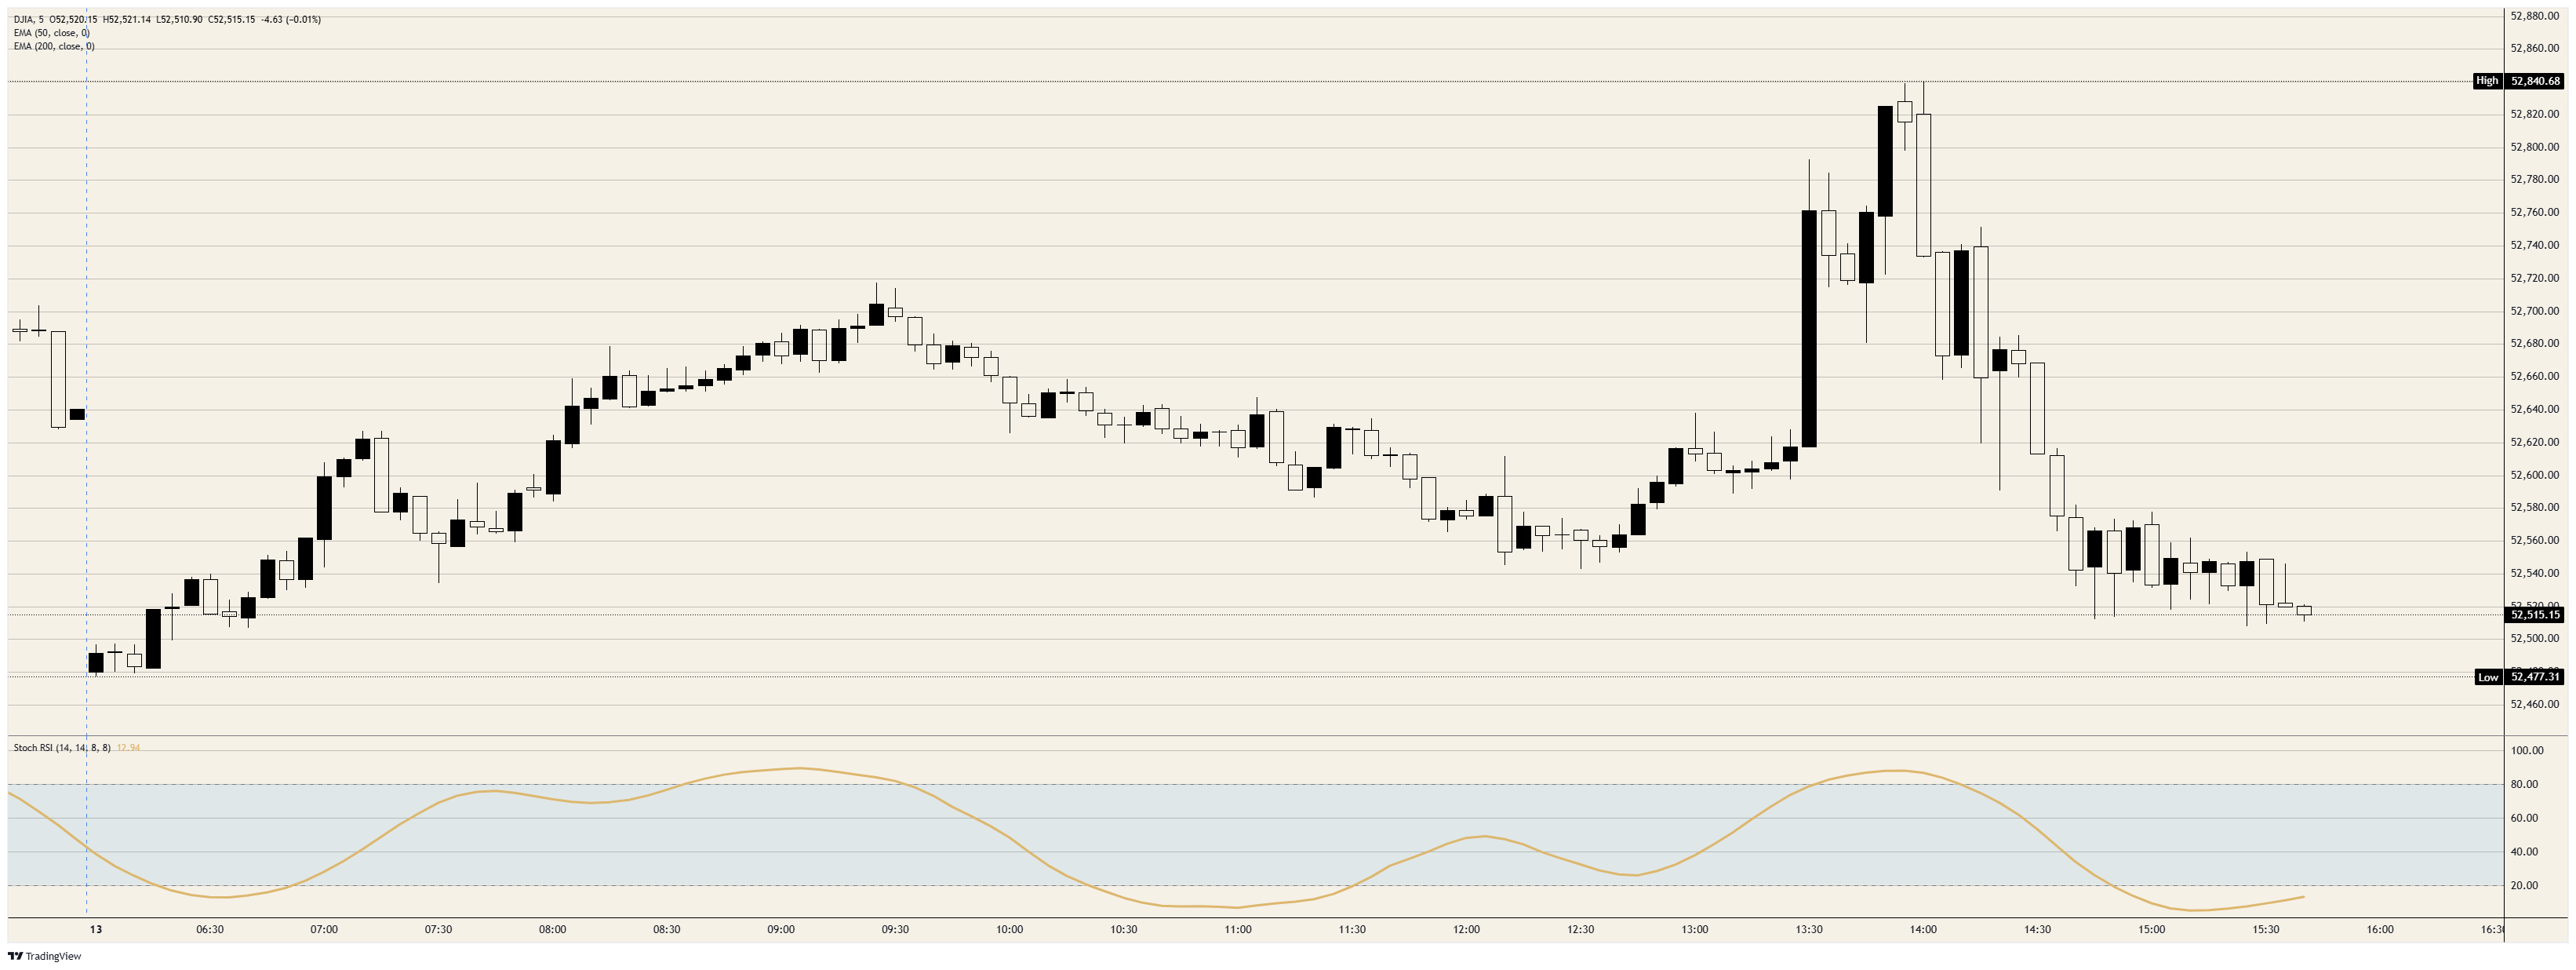
The index's intraday path tells the story in miniature. A mid-afternoon surge carried the average to the session high at 52,840.68 before the blockade language crossed the wires, and the entire move unravelled within the hour; the index now sits nearer the early-session low at 52,477.31 than the peak it printed earlier in the afternoon, and is on track for a modest daily loss.
The Dow's relative resilience is structural rather than heroic. A price-weighted average tilted toward industrials, healthcare, and financials absorbs a semiconductor rout far better than its capitalization-weighted peers, which is the entire reason Monday's damage stops at 0.2% here while the tech-heavy benchmarks bleed multiples of that.
Semiconductors pay the toll first
The concentrated selling landed on the market's most crowded trade, which is what happens when consensus positioning meets a headline it cannot model. SK Hynix (SKHY) trades 7% lower in its second United States session after a 13% debut pop on Friday, Micron (MU) is down 6%, Sandisk (SNDK) sheds 10%, and Seagate (STX) loses 6%, with Advanced Micro Devices (AMD) 4% lower alongside Intel (INTC).
The drawdown arrives despite, or perhaps because of, the bullish scaffolding underneath the group. One brokerage strategist argued in a Monday note that hyperscaler capital spending plans will be reaffirmed and keep rising through 2028, with artificial intelligence mentions across all 11 sectors up 98% YoY; winners carrying that much consensus are precisely what gets sold when a tape demands cash in a hurry. The money-centre banks trade lower too, ahead of quarterly results that begin landing this week, with consensus pegging second-quarter S&P 500 profit growth above 23% YoY.
Tuesday stacks a disinflation print against an energy shock
The June Consumer Price Index (CPI) lands Tuesday at 12:30 GMT, with consensus looking for a 0.1% monthly decline on the headline and a deceleration to 3.8% YoY from 4.2%; the core measure is seen at 0.2% MoM and holding at 2.9% YoY. That report was drafted as the week's clean disinflation story, and Monday's Crude Oil move complicates the sequel; a fresh energy shock will not appear in June's data, but it rewrites what the July and August prints are allowed to look like.
The Federal Reserve (Fed) Chair follows at 14:00 GMT with the first of two congressional appearances this week, and the backdrop gives lawmakers plenty to work with. The committee held at 3.75% last month, scrubbed its easing bias, and marked the dot plot hawkishly. Rate futures now assign roughly one-in-five odds to a hike at the late July meeting against effectively nothing for a cut. Retail Sales on Thursday at 12:30 GMT rounds out the week's red-band docket.
Levels and bias
Resistance: The session high at 52,840 is the first ceiling, and Monday's sharp rejection there gives the level teeth; beyond it, the July peak at 53,333 is the only structure left above the market.
Support: The early-session low at 52,477 guards the 52,000 handle; beneath the round number, the 50-day Exponential Moving Average (EMA) at 51,181 has contained every daily pullback since April and remains the trend arbiter.
Bias: Lower. The daily Stochastic Relative Strength Index is rolling over from overbought territory, the afternoon failure at 52,840 shows sellers responding to headlines rather than levels, and the blockade is a fee schedule with no off-ramp priced in; rallies are for selling below 52,840, and a daily close under 52,477 opens the 52,000 handle.
Dow Jones 5-minute chart
Dow Jones FAQs
The Dow Jones Industrial Average, one of the oldest stock market indices in the world, is compiled of the 30 most traded stocks in the US. The index is price-weighted rather than weighted by capitalization. It is calculated by summing the prices of the constituent stocks and dividing them by a factor, currently 0.152. The index was founded by Charles Dow, who also founded the Wall Street Journal. In later years it has been criticized for not being broadly representative enough because it only tracks 30 conglomerates, unlike broader indices such as the S&P 500.
Many different factors drive the Dow Jones Industrial Average (DJIA). The aggregate performance of the component companies revealed in quarterly company earnings reports is the main one. US and global macroeconomic data also contributes as it impacts on investor sentiment. The level of interest rates, set by the Federal Reserve (Fed), also influences the DJIA as it affects the cost of credit, on which many corporations are heavily reliant. Therefore, inflation can be a major driver as well as other metrics which impact the Fed decisions.
Dow Theory is a method for identifying the primary trend of the stock market developed by Charles Dow. A key step is to compare the direction of the Dow Jones Industrial Average (DJIA) and the Dow Jones Transportation Average (DJTA) and only follow trends where both are moving in the same direction. Volume is a confirmatory criteria. The theory uses elements of peak and trough analysis. Dow’s theory posits three trend phases: accumulation, when smart money starts buying or selling; public participation, when the wider public joins in; and distribution, when the smart money exits.
There are a number of ways to trade the DJIA. One is to use ETFs which allow investors to trade the DJIA as a single security, rather than having to buy shares in all 30 constituent companies. A leading example is the SPDR Dow Jones Industrial Average ETF (DIA). DJIA futures contracts enable traders to speculate on the future value of the index and Options provide the right, but not the obligation, to buy or sell the index at a predetermined price in the future. Mutual funds enable investors to buy a share of a diversified portfolio of DJIA stocks thus providing exposure to the overall index.
Author

Joshua Gibson
FXStreet
Joshua joins the FXStreet team as an Economics and Finance double major from Vancouver Island University with twelve years' experience as an independent trader focusing on technical analysis.

















