Dow Jones Industrial Average trims back after tepid Monday session
- Dow Jones held close to the middle on a thin start to the new trading week.
- Equities to remain nervous ahead of key inflation data.
- Fresh batch of US PPI and CPI inflation prints due this week.

The Dow Jones Industrial Average (DJIA) pulled into the middle again on Monday, echoing last Friday’s stubborn midrange pin after investors' half-hearted attempts to stage a technical rally in the equity index fizzled near key technical levels. Momentum is set to remain subdued as investors buckle down for the wait to key midweek Consumer Price Index (CPI) inflation figures due on Wednesday.
US Producer Price Index (PPI) business-level inflation figures are on the docket for Tuesday, and markets are hoping for a continued easing in structural inflation pressures. Core PPI for the year ended in July is forecast to ease to 2.7% from the previous 3.0%.
Wednesday’s YoY core CPI inflation is likewise expected to tick down to 3.2% from the previous 3.3%. Markets have trapped themselves in a Goldilocks forecast scenario; if CPI comes in too high, market sentiment will take a hit. On the other hand, if CPI comes in too low, it could spark another fear-fueled pullback, leaving the only topside option available to equities a soft but not too soft inflation print.
Dow Jones news
Two-thirds of the Dow Jones board is in the red on Monday as investors look for a meaningful foothold. Walmart Inc. (WMT) and Unitedhealth Group Inc. (UNH) rose over 1.5% apiece, while losses were led by Procter & Gamble Co. (PG) and Boeing Co. (BA), each of which fell around 2% on the day.
Dow Jones price forecast
The Dow Jones traded on the tepid side on Monday, testing down around four-tenths of one percent as intraday price action struggles to find a grip on the 50-day Exponential Moving Average (EMA) near 39,583.00. The index remains down around 5% from its all-time high of 41,371.38, but bidders stepped in to keep it from falling into the 200-day EMA at 37,962.00.
The index’s nearly 7% top-to-bottom plunge kicked off earlier in the month knocked investors off their balance, but price action has recovered after finding a floor near 38,382.00. Traders should expect a continued topside recovery back over the 50-day EMA to challenge the 40,000.00 major price handle once more, but investors will be waiting for the results from upcoming inflation data prints before stepping fully in.
Dow Jones daily chart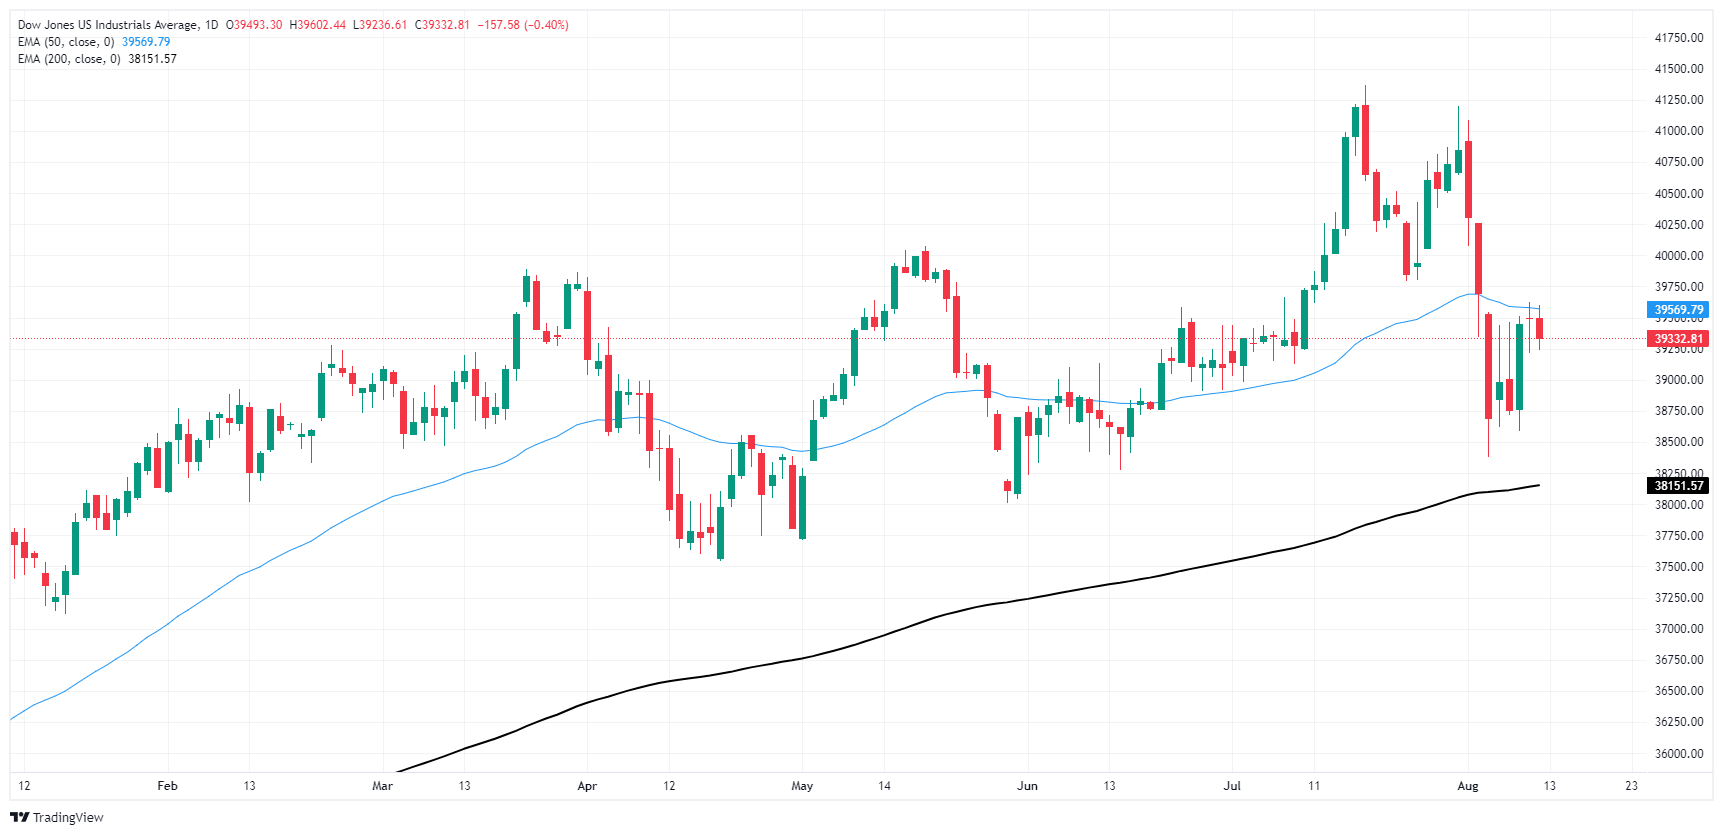
Dow Jones FAQs
The Dow Jones Industrial Average, one of the oldest stock market indices in the world, is compiled of the 30 most traded stocks in the US. The index is price-weighted rather than weighted by capitalization. It is calculated by summing the prices of the constituent stocks and dividing them by a factor, currently 0.152. The index was founded by Charles Dow, who also founded the Wall Street Journal. In later years it has been criticized for not being broadly representative enough because it only tracks 30 conglomerates, unlike broader indices such as the S&P 500.
Many different factors drive the Dow Jones Industrial Average (DJIA). The aggregate performance of the component companies revealed in quarterly company earnings reports is the main one. US and global macroeconomic data also contributes as it impacts on investor sentiment. The level of interest rates, set by the Federal Reserve (Fed), also influences the DJIA as it affects the cost of credit, on which many corporations are heavily reliant. Therefore, inflation can be a major driver as well as other metrics which impact the Fed decisions.
Dow Theory is a method for identifying the primary trend of the stock market developed by Charles Dow. A key step is to compare the direction of the Dow Jones Industrial Average (DJIA) and the Dow Jones Transportation Average (DJTA) and only follow trends where both are moving in the same direction. Volume is a confirmatory criteria. The theory uses elements of peak and trough analysis. Dow’s theory posits three trend phases: accumulation, when smart money starts buying or selling; public participation, when the wider public joins in; and distribution, when the smart money exits.
There are a number of ways to trade the DJIA. One is to use ETFs which allow investors to trade the DJIA as a single security, rather than having to buy shares in all 30 constituent companies. A leading example is the SPDR Dow Jones Industrial Average ETF (DIA). DJIA futures contracts enable traders to speculate on the future value of the index and Options provide the right, but not the obligation, to buy or sell the index at a predetermined price in the future. Mutual funds enable investors to buy a share of a diversified portfolio of DJIA stocks thus providing exposure to the overall index.
Author

Joshua Gibson
FXStreet
Joshua joins the FXStreet team as an Economics and Finance double major from Vancouver Island University with twelve years' experience as an independent trader focusing on technical analysis.


