Dow Jones Industrial Average spins its wheels as investors await key data
- The Dow Jones marked out familiar territory near 44,500.
- Equity traders were pushed into a cautious stance after a policy pivot from China.
- Investors will get a breather from high impact data until midweek CPI inflation figures.

The Dow Jones Industrial Average (DJIA) churned near 44,600 as equities kick off the new trading week on a quiet note. Markets bucked early Monday after China announced its first official monetary policy shift in 13 years. However, risk appetite was hobbled by geopolitical risks from the Middle East and South Korea.
Political turbulence dampened investor mood during Monday’s overnight session. Chinese political leaders signaled a looser monetary policy strategy next year, clearing the way for the Chinese government to pursue further stimulus policies directly. Stocks exposed to Chinese markets rallied for a strong start to the week. Not all is rosy on the China front, however: Chinese authorities have declared an antitrust investigation into Nvidia (NVDA) over supposed violations of obscure anti-monopoly laws. The move is perceived as a retaliation against US sanctions meant to cripple China’s access to advanced chip technology.
South Korea’s latest political turmoil is evolving into complete gridlock after South Korean President Yoon Suk Yeol’s failed coup via martial law was soundly rejected by the South Korean Parliament. Despite getting soundly rejected by political leaders within South Korea, lawmakers were unable to reach consensus on what to do in response, with an initial impeachment vote failing to reach the required threshold. Members of the South Korean opposition party are immediately calling for another impeachment vote.
Middle East tensions continue to run on the high side following the overthrow of Bashar al-Assad’s Syrian government. The freshly deposed dictator has reportedly fled to Moscow following the overthrow of a decades-long regime. Further destabilization in the Middle East has bolstered Crude Oil prices but kept overall investor sentiment within the region at bay.
Investors will be looking ahead to a fresh print of US Consumer Price Index (CPI) inflation slated for Wednesday, with a thin docket on the offering for the early week. US CPI inflation is expected to tick up again on an annualized basis in November. Median market forecasts expect Wednesday’s US CPI inflation to rise to 2.7% YoY compared to October’s 2.6%.
Dow Jones news
The Dow Jones equity board is on-balance on Monday with listed equities split roughly down the middle between gainers and losers. Boeing (BA) rose 4.5% to test $161 per share after announcing further layoffs in Washington, keeping in-line with the company’s plans to axe 10% of its global workforce in a bid to prove to investors they’re willing to do whatever it takes to achieve profitability and cut costs, even if it means crippling their ability to meet customer orders in the future.
Dow Jones price forecast
The Dow Jones’ post-Trump election rally is once again running aground of tepid investor sentiment, and the major equity index is poised for further downside after bulls ran out of gas near the 45,000 major price handle. Despite congestion hobbling topside momentum, price action has yet to commit to a move south.
The 50-day Exponential Moving Average (EMA) is rising through 43,400, providing a convenient floor for bidders to return to the fold if downside momentum wins the tug of war. The Dow Jones is up 18% YTD, but poised for a retracement after climbing 7.6% in November alone.
Dow Jones daily chart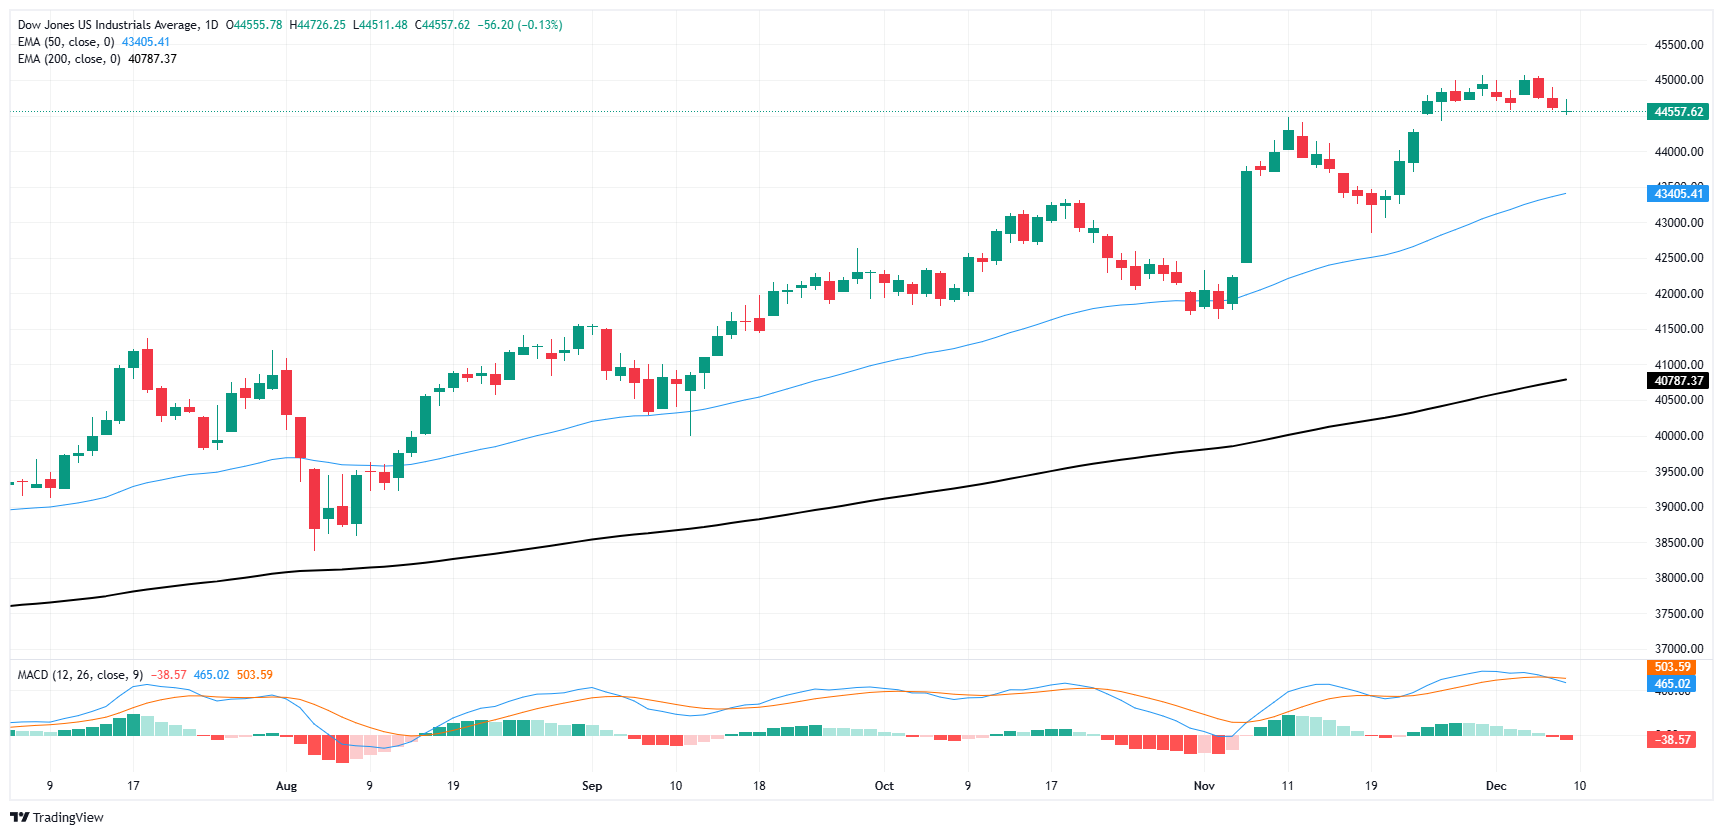
Dow Jones FAQs
The Dow Jones Industrial Average, one of the oldest stock market indices in the world, is compiled of the 30 most traded stocks in the US. The index is price-weighted rather than weighted by capitalization. It is calculated by summing the prices of the constituent stocks and dividing them by a factor, currently 0.152. The index was founded by Charles Dow, who also founded the Wall Street Journal. In later years it has been criticized for not being broadly representative enough because it only tracks 30 conglomerates, unlike broader indices such as the S&P 500.
Many different factors drive the Dow Jones Industrial Average (DJIA). The aggregate performance of the component companies revealed in quarterly company earnings reports is the main one. US and global macroeconomic data also contributes as it impacts on investor sentiment. The level of interest rates, set by the Federal Reserve (Fed), also influences the DJIA as it affects the cost of credit, on which many corporations are heavily reliant. Therefore, inflation can be a major driver as well as other metrics which impact the Fed decisions.
Dow Theory is a method for identifying the primary trend of the stock market developed by Charles Dow. A key step is to compare the direction of the Dow Jones Industrial Average (DJIA) and the Dow Jones Transportation Average (DJTA) and only follow trends where both are moving in the same direction. Volume is a confirmatory criteria. The theory uses elements of peak and trough analysis. Dow’s theory posits three trend phases: accumulation, when smart money starts buying or selling; public participation, when the wider public joins in; and distribution, when the smart money exits.
There are a number of ways to trade the DJIA. One is to use ETFs which allow investors to trade the DJIA as a single security, rather than having to buy shares in all 30 constituent companies. A leading example is the SPDR Dow Jones Industrial Average ETF (DIA). DJIA futures contracts enable traders to speculate on the future value of the index and Options provide the right, but not the obligation, to buy or sell the index at a predetermined price in the future. Mutual funds enable investors to buy a share of a diversified portfolio of DJIA stocks thus providing exposure to the overall index.
Author

Joshua Gibson
FXStreet
Joshua joins the FXStreet team as an Economics and Finance double major from Vancouver Island University with twelve years' experience as an independent trader focusing on technical analysis.


