Dow Jones Industrial Average slides as Iran deadline looms, Oil tops $116
- The Dow fell over 380 points as hopes for a US-Iran ceasefire deal faded ahead of President Trump's 00:00 GMT Wednesday deadline.
- West Texas Intermediate Crude Oil futures surged above $116 per barrel on reports the US struck Kharg Island overnight.
- Broadcom bucked the trend, rising 3% after announcing expanded artificial intelligence chip deals with Google and Anthropic.
- Durable goods orders fell 1.4% in February, though core capital goods orders beat expectations at 0.6% MoM.

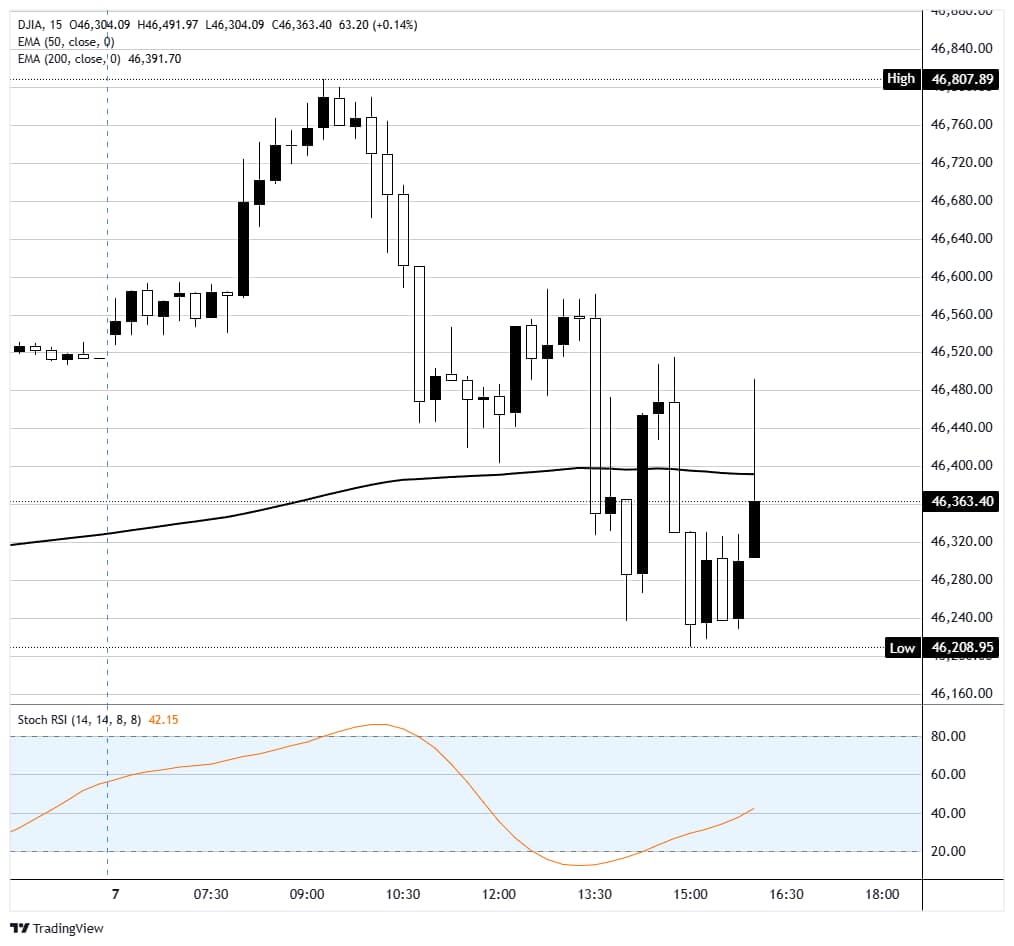
The Dow Jones Industrial Average (DJIA) dropped around 380 points, or 0.8%, snapping a four-session winning streak as risk appetite collapsed in the hours before President Trump's self-imposed deadline for Iran to agree to reopen the Strait of Hormuz. The S&P 500 fell 0.9% and the Nasdaq Composite shed 1.3%, with losses accelerating after the New York Times reported that Iran had stopped negotiating a truce with the US. The DJIA opened near session highs above 46,800 before selling off steadily through the afternoon, breaking below its 200-period moving average and settling near 46,300.
Iran deadline dominates risk sentiment
The session's price action was dictated almost entirely by geopolitical headlines. Trump set a deadline of 00:00 GMT Wednesday for Iran to strike a deal on reopening the Strait, threatening to destroy the country's power plants and bridges if no agreement was reached. Reports from the Wall Street Journal and NBC News that US forces carried out overnight strikes on Kharg Island, Iran's primary Oil export terminal, only added to the tension. Negotiators told the Journal they were not optimistic a deal could be reached in time, though Iranian state media indicated talks had not been formally closed. Trump's own comments on Truth Social struck an ominous tone but left some ambiguity about whether strikes would proceed immediately after the deadline.
Oil surges, Gold holds near $4,700
The escalation sent crude prices sharply higher. West Texas Intermediate (WTI) futures climbed 3% to above $116 per barrel, while international Brent crude advanced above $110. The Strait of Hormuz handles roughly a fifth of global Oil supply, and any prolonged disruption would compound the energy price shock that has weighed on equities since the conflict began in early March. Gold traded in a narrow range near $4,660, holding elevated levels but failing to capitalize on the risk-off mood. Facet chief investment officer Tom Graff told CNBC that while investors should expect Oil prices to stay "significantly higher" than pre-war levels, he views the Strait closure as a negotiating tactic rather than a permanent condition.
Broadcom bucks the selloff on AI deals
Broadcom (AVGO) was one of the session's few bright spots, rising 3% after disclosing expanded artificial intelligence partnerships with Google (GOOG) and Anthropic. A regulatory filing revealed a long-term agreement for Broadcom to develop and supply next-generation Tensor Processing Units (TPUs) for Google, along with networking infrastructure through 2031. Separately, Anthropic will access approximately 3.5 gigawatts of TPU-based compute capacity through Broadcom starting in 2027. Anthropic disclosed that its revenue run rate has topped $30 billion, up from $9 billion at the end of 2025, with over 1K business customers now spending more than $1 million annually.
Durable goods disappoint on the headline, but core orders surprise
February durable goods data, delayed from its original March release date, came in at -1.4% MoM against expectations of -0.5%, dragged lower by a 5.4% drop in transportation equipment. However, the more closely watched ex-transportation reading came in at +0.8%, well above the 0.5% consensus and marking the eleventh straight month of gains. Core capital goods orders excluding defense and aircraft rose 0.6% MoM, beating the 0.5% estimate and suggesting that business investment spending remains resilient despite the geopolitical uncertainty. The data had minimal market impact given the overwhelming focus on Iran.
Heavy data week ahead
Traders are bracing for a packed calendar that could reshape the Federal Reserve (Fed) policy outlook. Federal Open Market Committee (FOMC) minutes land on Wednesday, followed by Q4 Gross Domestic Product (GDP) revisions and February Personal Consumption Expenditures Price Index (PCE) data on Thursday. Friday brings March Consumer Price Index (CPI), which markets will scrutinize for any early signs that the war-driven Oil shock is filtering into broader consumer prices. The Cboe Volatility Index (VIX) closed near 24, still well below the spike to 60 seen a year ago on tariff liberation day, but elevated enough to suggest hedging demand remains firmly in place. With the Iran deadline now hours away, all eyes are on whether diplomacy produces a last-minute breakthrough or whether the conflict enters a far more dangerous phase.
Dow Jones 15-minute chart
Dow Jones FAQs
The Dow Jones Industrial Average, one of the oldest stock market indices in the world, is compiled of the 30 most traded stocks in the US. The index is price-weighted rather than weighted by capitalization. It is calculated by summing the prices of the constituent stocks and dividing them by a factor, currently 0.152. The index was founded by Charles Dow, who also founded the Wall Street Journal. In later years it has been criticized for not being broadly representative enough because it only tracks 30 conglomerates, unlike broader indices such as the S&P 500.
Many different factors drive the Dow Jones Industrial Average (DJIA). The aggregate performance of the component companies revealed in quarterly company earnings reports is the main one. US and global macroeconomic data also contributes as it impacts on investor sentiment. The level of interest rates, set by the Federal Reserve (Fed), also influences the DJIA as it affects the cost of credit, on which many corporations are heavily reliant. Therefore, inflation can be a major driver as well as other metrics which impact the Fed decisions.
Dow Theory is a method for identifying the primary trend of the stock market developed by Charles Dow. A key step is to compare the direction of the Dow Jones Industrial Average (DJIA) and the Dow Jones Transportation Average (DJTA) and only follow trends where both are moving in the same direction. Volume is a confirmatory criteria. The theory uses elements of peak and trough analysis. Dow’s theory posits three trend phases: accumulation, when smart money starts buying or selling; public participation, when the wider public joins in; and distribution, when the smart money exits.
There are a number of ways to trade the DJIA. One is to use ETFs which allow investors to trade the DJIA as a single security, rather than having to buy shares in all 30 constituent companies. A leading example is the SPDR Dow Jones Industrial Average ETF (DIA). DJIA futures contracts enable traders to speculate on the future value of the index and Options provide the right, but not the obligation, to buy or sell the index at a predetermined price in the future. Mutual funds enable investors to buy a share of a diversified portfolio of DJIA stocks thus providing exposure to the overall index.
Author

Joshua Gibson
FXStreet
Joshua joins the FXStreet team as an Economics and Finance double major from Vancouver Island University with twelve years' experience as an independent trader focusing on technical analysis.

















