Dow Jones Industrial Average round-trips a Fed that promised nothing
- DJIA trades near 53,700, up 0.18%, after a 320-point round trip.
- September Fed hike odds jumped above 55% from 35.4% a day earlier.
- Two-year Treasury yields rose more than 6 basis points, the long end flat.

The Federal Reserve (Fed) chair used the largest speaking slot on the calendar to commit to nothing and the futures market repriced September anyway. Odds of a quarter-point increase jumped above 55% on Friday from 35.4% a day earlier, on a keynote that declined to offer forward guidance, declined to set out a reaction function, and bound its author to a discipline rather than a decision. The Dow Jones Industrial Average printed its low of the day into it and its first look above 53,800 since mid-month ninety minutes later.
A speech built to withhold
The address opened by describing whatever followed as a route map rather than forward guidance, a practice the chair judged to have outstayed its welcome. He called the economy resilient and the labour market broadly consistent with full employment, then said the summer Consumer Price Index (CPI) and Personal Consumption Expenditures (PCE) readings had come in better than expected without persuading him that underlying trends had improved, and that the Committee has work to do if that does not change.
What the text withheld matters more than what it carried. There was no statement of the conditions that would move the Committee, no signal on direction, and no numerical threshold attached to any of it, only a commitment to method. A market still has to hold a position into September 16, so with the reaction function removed it prices the Committee off tone instead. Twenty points of hike probability moved on a document whose stated purpose was to promise nothing.
The tension inside the speech is that it pledges rules while refusing to state one. The chair committed his term to building more reliable models and more robust policy rules, then described forecasting accuracy as an aspiration and counselled modesty about what a central bank can know while geopolitics, supply chains and technology move this fast. A rule that arrives later is not a rule anyone can position around three weeks from now.
The omission that moved the curve
Nothing in the address touched the Treasury operation that doubles the ceiling on longer-dated buybacks from September 9 and supplies duration support the Committee never voted on. A chair who has argued for a smaller government footprint in markets, and who has credited bond-market tightening with doing part of his own job, passed over the fiscal authority quietly undoing both. The single largest constraint on his policy was the one subject the speech left alone.
The curve answered precisely. Two-year yields, the tenor that prices the Committee, rose more than six basis points to their highest in a month, while the long end held flat. A hawkish keynote that flattens the curve rather than lifting it is a market saying the front end still belongs to the Federal Reserve and the back end now belongs to whoever is buying the bonds. That division is the whole of August compressed into one afternoon.
What the index actually did
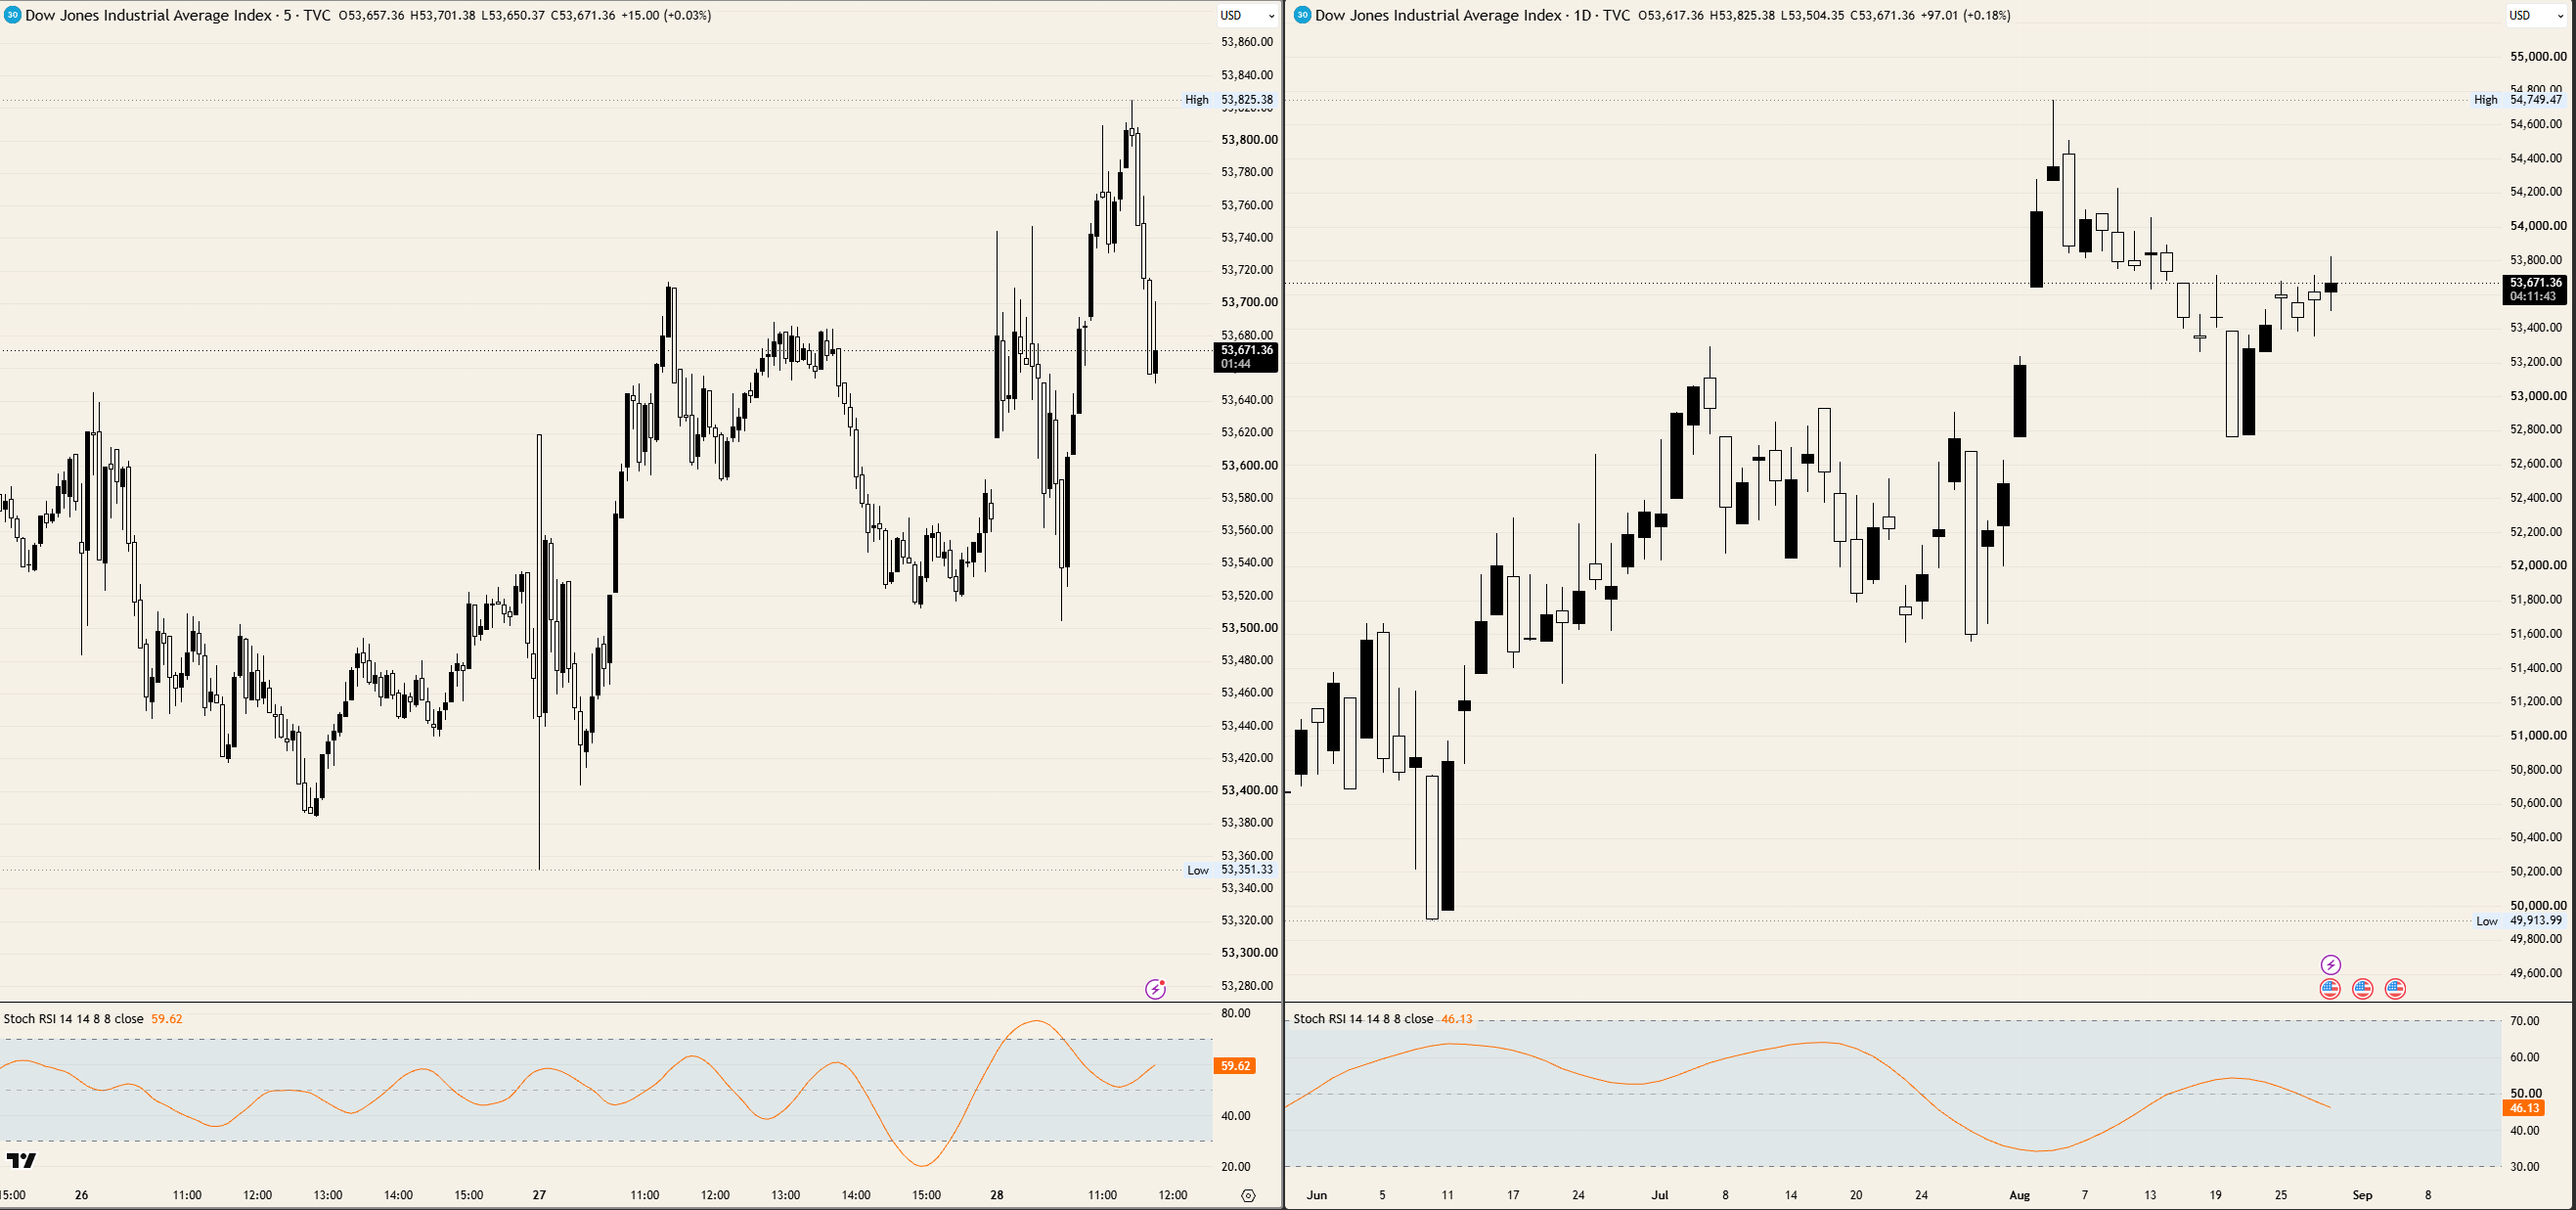
Equity behaviour under the same text was far less decided than a positive session suggests. The index printed the low of the day into the address, ran roughly 320 points to sell just above 53,800, then handed back more than half of that inside the following hour to sit near 53,700, up 0.18%. A 320-point range that resolves in the middle is not a market that heard an answer.
The week still lands higher, the first of three to do so, with the S&P 500 and the Nasdaq Composite both firmer on the session. That leaves an index roughly 2% beneath a record set on August 5 and capped for a third straight week by the same band it failed at today, gaining on a session that raised the odds of tighter policy by twenty points.
The week that decides it
The symposium runs through August 29 with the rest of the Committee still speaking, so the tone reading has two more days to move without a single new number attached to it. August payrolls land September 4 and the decision follows on September 16, the first date since June on which the front end and the index have to agree on something. Until then the only guidance on offer is the data itself, which is precisely the design.
Levels to watch
Resistance: The band just above 53,800 sold the session high and has capped every attempt since mid-month. Above it 54,000 is the next line, with the early-August ledge near 54,100 and the record just short of 54,750 beyond.
Support: The 53,500 handle caught the session low and is the first floor. Beneath it, 53,200 is the shelf, with the 53,000 handle and the August base under it.
Bias: Bearish while 53,800 caps, with objectives at 53,500 and then the 53,200 area. The daily Stochastic Relative Strength Index (Stoch RSI) near 46 has rolled over from mid-range without the index making a new high. Invalidation on a daily close above 53,900.
Dow Jones 5-minute and daily charts
Dow Jones FAQs
The Dow Jones Industrial Average, one of the oldest stock market indices in the world, is compiled of the 30 most traded stocks in the US. The index is price-weighted rather than weighted by capitalization. It is calculated by summing the prices of the constituent stocks and dividing them by a factor, currently 0.152. The index was founded by Charles Dow, who also founded the Wall Street Journal. In later years it has been criticized for not being broadly representative enough because it only tracks 30 conglomerates, unlike broader indices such as the S&P 500.
Many different factors drive the Dow Jones Industrial Average (DJIA). The aggregate performance of the component companies revealed in quarterly company earnings reports is the main one. US and global macroeconomic data also contributes as it impacts on investor sentiment. The level of interest rates, set by the Federal Reserve (Fed), also influences the DJIA as it affects the cost of credit, on which many corporations are heavily reliant. Therefore, inflation can be a major driver as well as other metrics which impact the Fed decisions.
Dow Theory is a method for identifying the primary trend of the stock market developed by Charles Dow. A key step is to compare the direction of the Dow Jones Industrial Average (DJIA) and the Dow Jones Transportation Average (DJTA) and only follow trends where both are moving in the same direction. Volume is a confirmatory criteria. The theory uses elements of peak and trough analysis. Dow’s theory posits three trend phases: accumulation, when smart money starts buying or selling; public participation, when the wider public joins in; and distribution, when the smart money exits.
There are a number of ways to trade the DJIA. One is to use ETFs which allow investors to trade the DJIA as a single security, rather than having to buy shares in all 30 constituent companies. A leading example is the SPDR Dow Jones Industrial Average ETF (DIA). DJIA futures contracts enable traders to speculate on the future value of the index and Options provide the right, but not the obligation, to buy or sell the index at a predetermined price in the future. Mutual funds enable investors to buy a share of a diversified portfolio of DJIA stocks thus providing exposure to the overall index.
Author

Joshua Gibson
FXStreet
Joshua joins the FXStreet team as an Economics and Finance double major from Vancouver Island University with twelve years' experience as an independent trader focusing on technical analysis.
















