Dow Jones Industrial Average races to records as Warsh eyes the punch bowl
- The Dow Jones Industrial Average printed a fresh all-time high, extending the rally sparked by the US-Iran ceasefire.
- Crude Oil's slide is unwinding the war-driven inflation spike that pushed rate markets toward hikes.
- Kevin Warsh chairs his first FOMC meeting on Wednesday, with markets still pricing roughly 60% odds of a December hike.

The Dow Jones Industrial Average pushed to a fresh all-time high near 52,100 on Tuesday, capping a two-day surge that is almost entirely about one thing: the apparent end of the war in Iran. Trump's announced ceasefire, which commits Washington and Tehran to reopening the Strait of Hormuz and lifting the naval blockade, has sent Crude Oil tumbling from its wartime peak and dragged the conflict's inflation premium down with it. The awkward detail is that the Federal Reserve (Fed) opens its first meeting under new Chair Kevin Warsh on Wednesday, and the rate market is still leaning the other way.
The peace trade is doing all the work
The rally's engine is Crude Oil, not earnings. The war that erupted in late February shut roughly a fifth of global supply behind a mined Strait of Hormuz and drove prices toward $120, feeding the inflation spike that dragged the Dow to the 45,000 region in April. With the guns apparently silent, Crude Oil has slid back into the mid-$70s, and the read-across is simple: lower energy costs, a fading inflation impulse, and less reason for the Fed to stay aggressive. The logic is sound, but nothing has been signed; earlier truces in this conflict collapsed before the ink dried, leaving a tape priced for success exposed if the choreography slips.
The hawk Trump hired
The uncomfortable part for the bulls is who is running Wednesday's meeting. Warsh was Trump's pick, chosen by a President who has spent months demanding lower rates, yet he arrives with inflation at a three-year high and a rate market positioned for tightening, not easing. CME FedWatch puts the odds of at least one hike by December near 60%, with a single quarter-point move to a 3.75% to 4.00% range the most likely outcome. The funds rate has held at 3.50% to 3.75% since December, and virtually nobody is pricing a cut this year. The man installed to deliver cuts is instead inheriting a market that only wants to know how many are coming.
Warsh is also hard to position around because of his open skepticism of forward guidance. He has signaled a preference for livelier, more contentious meetings, content to let committee disagreement show rather than hand markets a tidy rate path. April already produced four dissents, the most divided the Fed has been in over three decades, and a Chair who prizes that friction will not paper over it. For a market trained across fifteen years to expect hand-holding, a debut built on withholding it is a risk on its own.
Wednesday is the real catalyst
Nobody expects the funds rate to move; the decision lands at 18:00 GMT, the press conference at 18:30 GMT, and the outcome is close to a foregone conclusion. The market-moving content sits everywhere else: whether the committee drops its easing bias for a neutral stance, whether the fresh dot plot now shows hikes on the horizon, and how Warsh chooses to communicate in his first press conference. If the dots validate the hawkish lean already in the rate market and Warsh offers no reassurance, a Dow priced for peace has room to wobble. The asymmetry runs both ways: a measured debut could spark another leg higher.
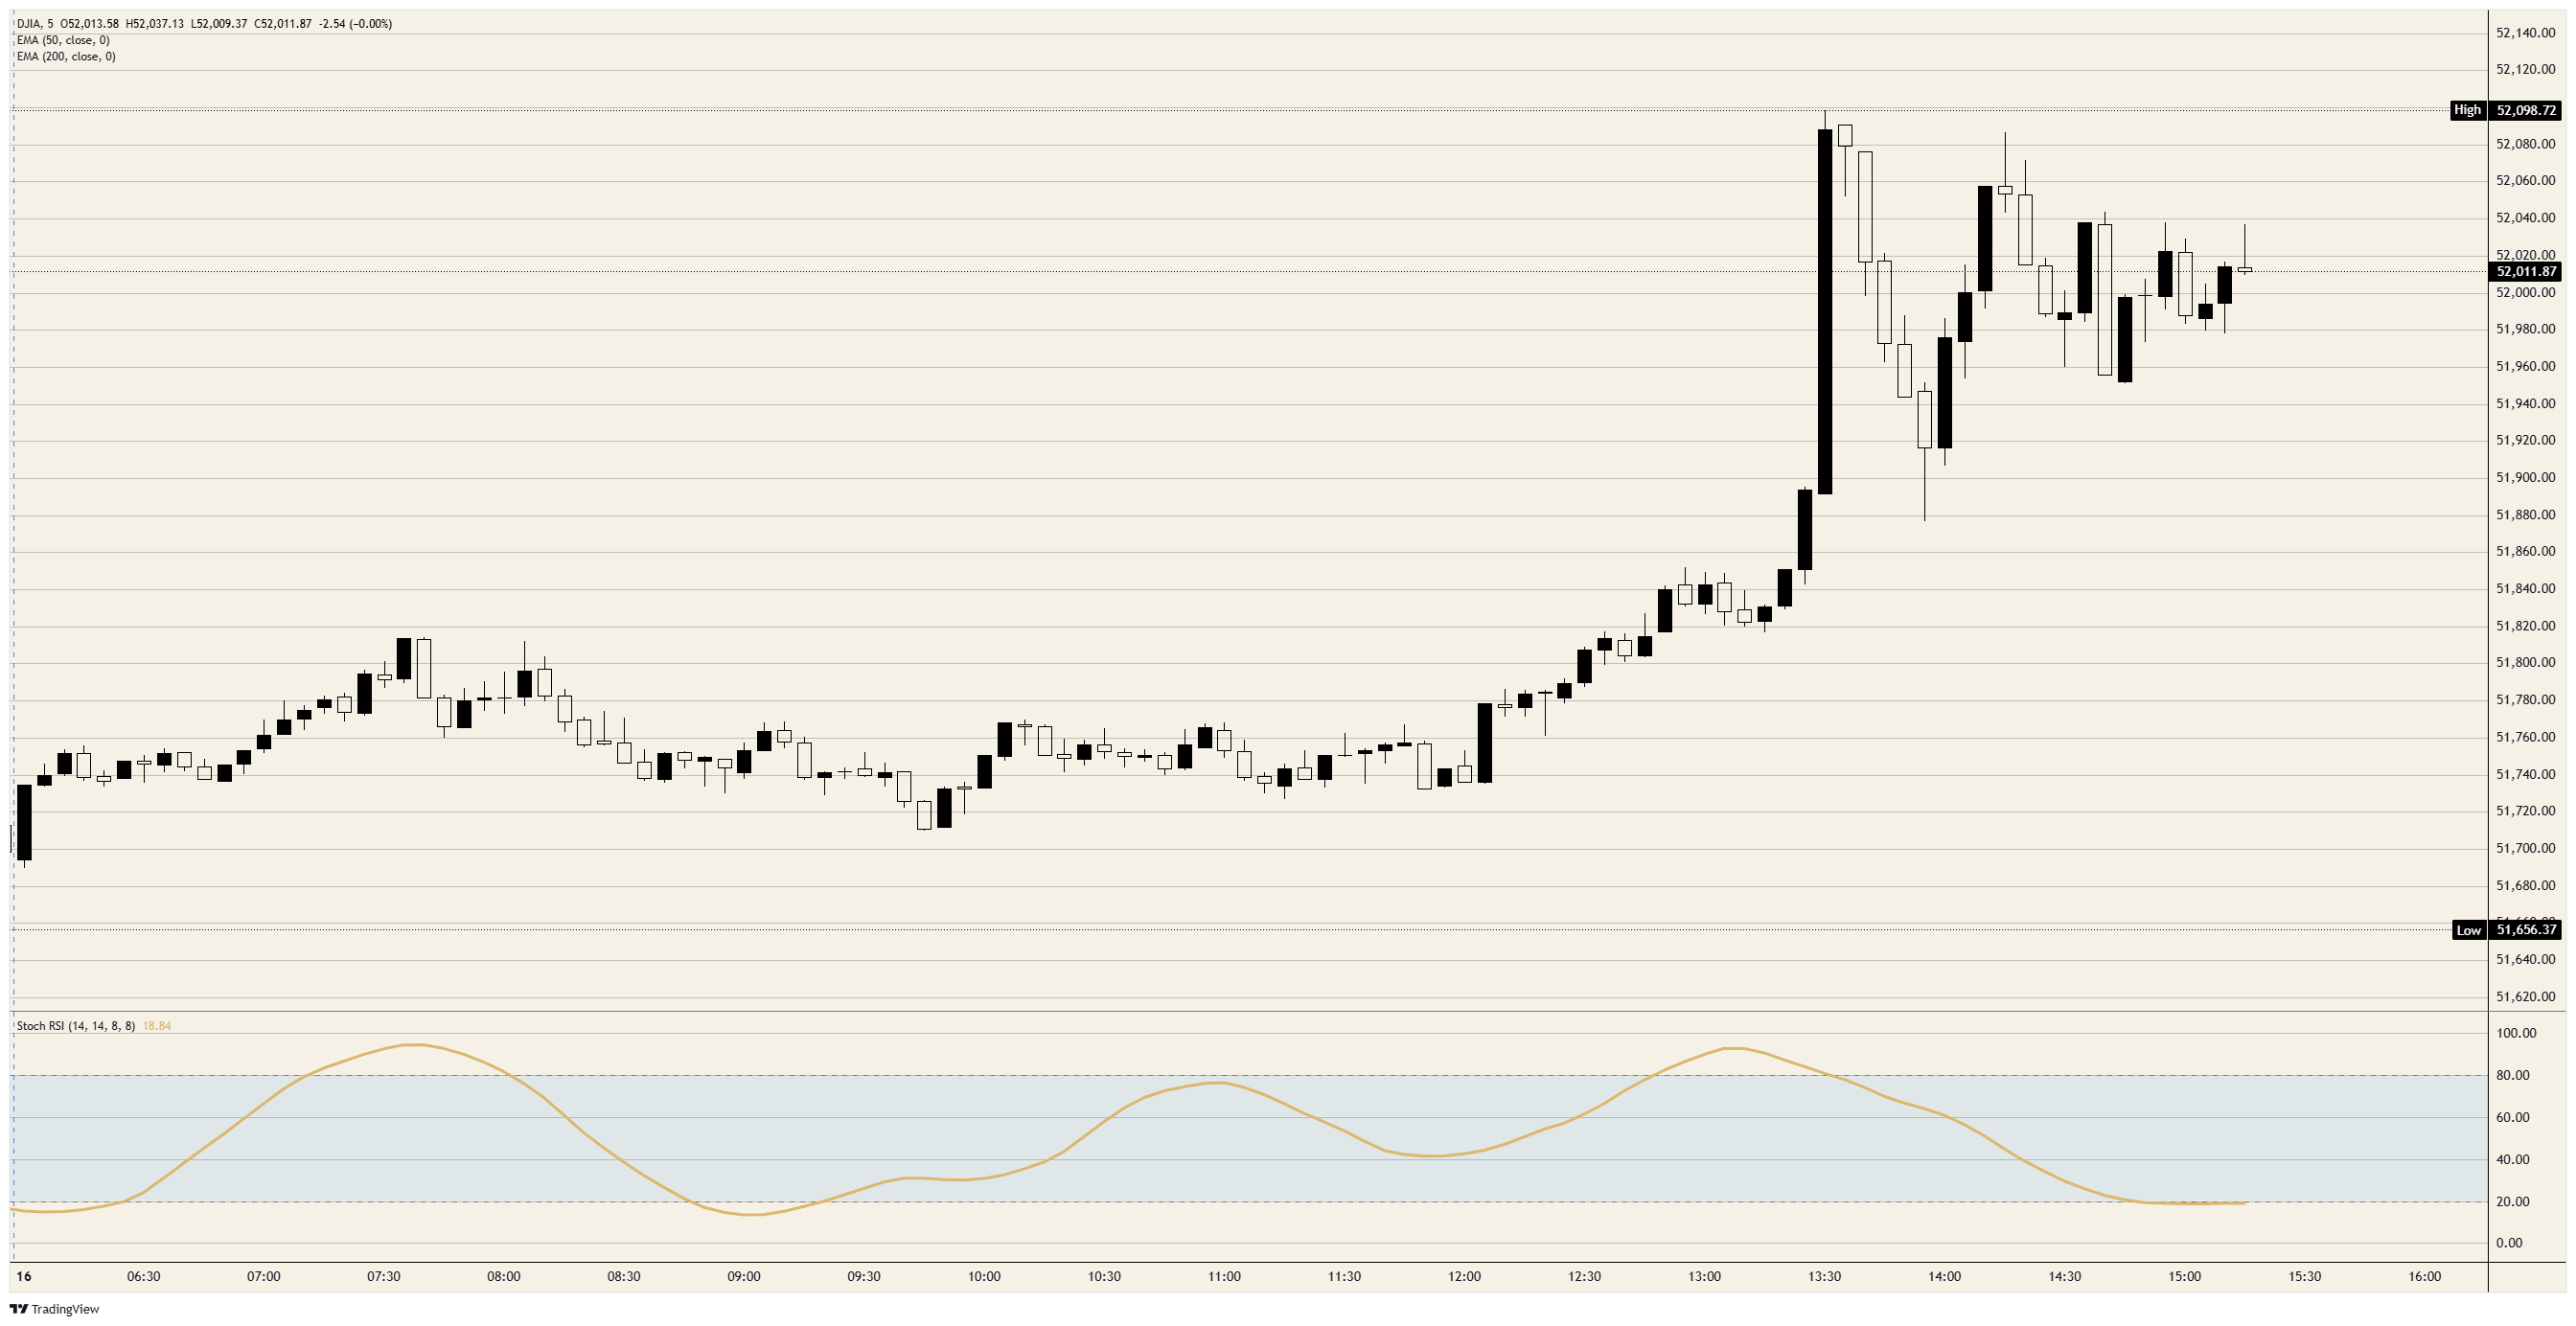
On the charts, the daily trend remains firmly higher, and the daily Stochastic Relative Strength Index (Stoch RSI) near 45 sits far from overbought despite the record. The intraday picture is more tired: the spike faded fast and the 5-minute Stoch RSI has rolled toward oversold near 19, a sign the burst has run its course even as the broader trend holds.
Resistance: Tuesday's record near 52,100 is the line in the sand; a clean break and hold above it opens blue sky with no overhead supply to lean on.
Support: The breakout shelf around 51,800 is the first floor, with Tuesday's session low close to 51,650 beneath it. A deeper unwind only puts the trend in question near the 50,000 area, where the rising 50-day Exponential Moving Average (EMA) sits.
Bias: Bullish while 51,800 holds and the ceasefire stays on track, but this is not a level to chase into the Fed. Warsh's debut and an unsigned deal are two live binaries, and a market priced this cleanly has more to lose on a stumble than to gain on confirmation. Buy weakness toward support while the deal holds; treat a decisive loss of 51,800 as the sign the peace-and-disinflation trade is unwinding.
Dow Jones 5-minute chart
Dow Jones FAQs
The Dow Jones Industrial Average, one of the oldest stock market indices in the world, is compiled of the 30 most traded stocks in the US. The index is price-weighted rather than weighted by capitalization. It is calculated by summing the prices of the constituent stocks and dividing them by a factor, currently 0.152. The index was founded by Charles Dow, who also founded the Wall Street Journal. In later years it has been criticized for not being broadly representative enough because it only tracks 30 conglomerates, unlike broader indices such as the S&P 500.
Many different factors drive the Dow Jones Industrial Average (DJIA). The aggregate performance of the component companies revealed in quarterly company earnings reports is the main one. US and global macroeconomic data also contributes as it impacts on investor sentiment. The level of interest rates, set by the Federal Reserve (Fed), also influences the DJIA as it affects the cost of credit, on which many corporations are heavily reliant. Therefore, inflation can be a major driver as well as other metrics which impact the Fed decisions.
Dow Theory is a method for identifying the primary trend of the stock market developed by Charles Dow. A key step is to compare the direction of the Dow Jones Industrial Average (DJIA) and the Dow Jones Transportation Average (DJTA) and only follow trends where both are moving in the same direction. Volume is a confirmatory criteria. The theory uses elements of peak and trough analysis. Dow’s theory posits three trend phases: accumulation, when smart money starts buying or selling; public participation, when the wider public joins in; and distribution, when the smart money exits.
There are a number of ways to trade the DJIA. One is to use ETFs which allow investors to trade the DJIA as a single security, rather than having to buy shares in all 30 constituent companies. A leading example is the SPDR Dow Jones Industrial Average ETF (DIA). DJIA futures contracts enable traders to speculate on the future value of the index and Options provide the right, but not the obligation, to buy or sell the index at a predetermined price in the future. Mutual funds enable investors to buy a share of a diversified portfolio of DJIA stocks thus providing exposure to the overall index.
Author

Joshua Gibson
FXStreet
Joshua joins the FXStreet team as an Economics and Finance double major from Vancouver Island University with twelve years' experience as an independent trader focusing on technical analysis.

















