Dow Jones Industrial Average adds 200 points as Fed rate cut expectations climb
- The Dow Jones followed tech stocks and Fed rate cut bets higher on Monday.
- Investors are tilting firmly into expectations of a 25 bps rate cut in December.
- Despite ongoing valuation concerns, the AI-led tech rally is recovering its footing.

The Dow Jones Industrial Average (DJIA) found some room on the high side on Monday, kicking off a holiday-shortened trading week with a 200-point jump to retest the 46,500 region. Equity indexes are broadly in a recovery stance following a shaky week at the tail-end of quarterly earnings season, but US major indexes still remain in the red for the month of November.
Hopes for a December rate cut remain elevated
Broad market hopes for the Federal Reserve (Fed) to deliver a third straight interest rate cut in December are holding on the high side on Monday. According to the CME’s FedWatch Tool, rate traders are pricing in nearly 80% odds of a 25-basis-point rate trim on December 10. There’s still plenty of wiggle room, however, with over 98% odds that the Fed will deliver another rate cut by January 28 if a December cut fails to materialize.
Thanks to the longest US government shutdown in history, the Bureau of Labor Statistics (BLS) has delayed the release of October and November labor and employment data until after the Fed’s interest rate decision. It will hold the key figures back until December 16. This leaves the Fed with little meaningful data to gauge interest rate moves, and it could vex hopes of a rate cut in the coming weeks.
US Producer Price Index (PPI) data due Tuesday could attract more market attention than usual. Still, the well-defined inflation category specifically excludes foreign-made or imported goods. It will provide little direct information on how the Trump administration’s scattershot tariff policies are affecting business costs beyond indirect price impacts.
AI rally continues to drive the broader market
The AI-fueled tech trade is back on the front burner after a defensive drop last week, sparked by ongoing concerns that all of the demand for LLM-powering microchips isn’t generating actual front-end revenue for the AI industry at large. Fears are growing that double-digit quarterly revenue growth for silicon-punching AI darling Nvidia (NVDA) may run out of roadway sooner rather than later.
Circular lending strategies that largely reinvent structured financial vehicles with no actual money involved have struck the tech sector as AI giants, and the shovel-sellers that supply them with compute power, have become the rule rather than the exception. Investors are growing fearful that the music may stop without enough chairs for everyone to sit.
Despite the ongoing funding fears, Nvidia is back on the rise on Monday, gaining around 2.25% at the time of writing and climbing back above $180 per share.
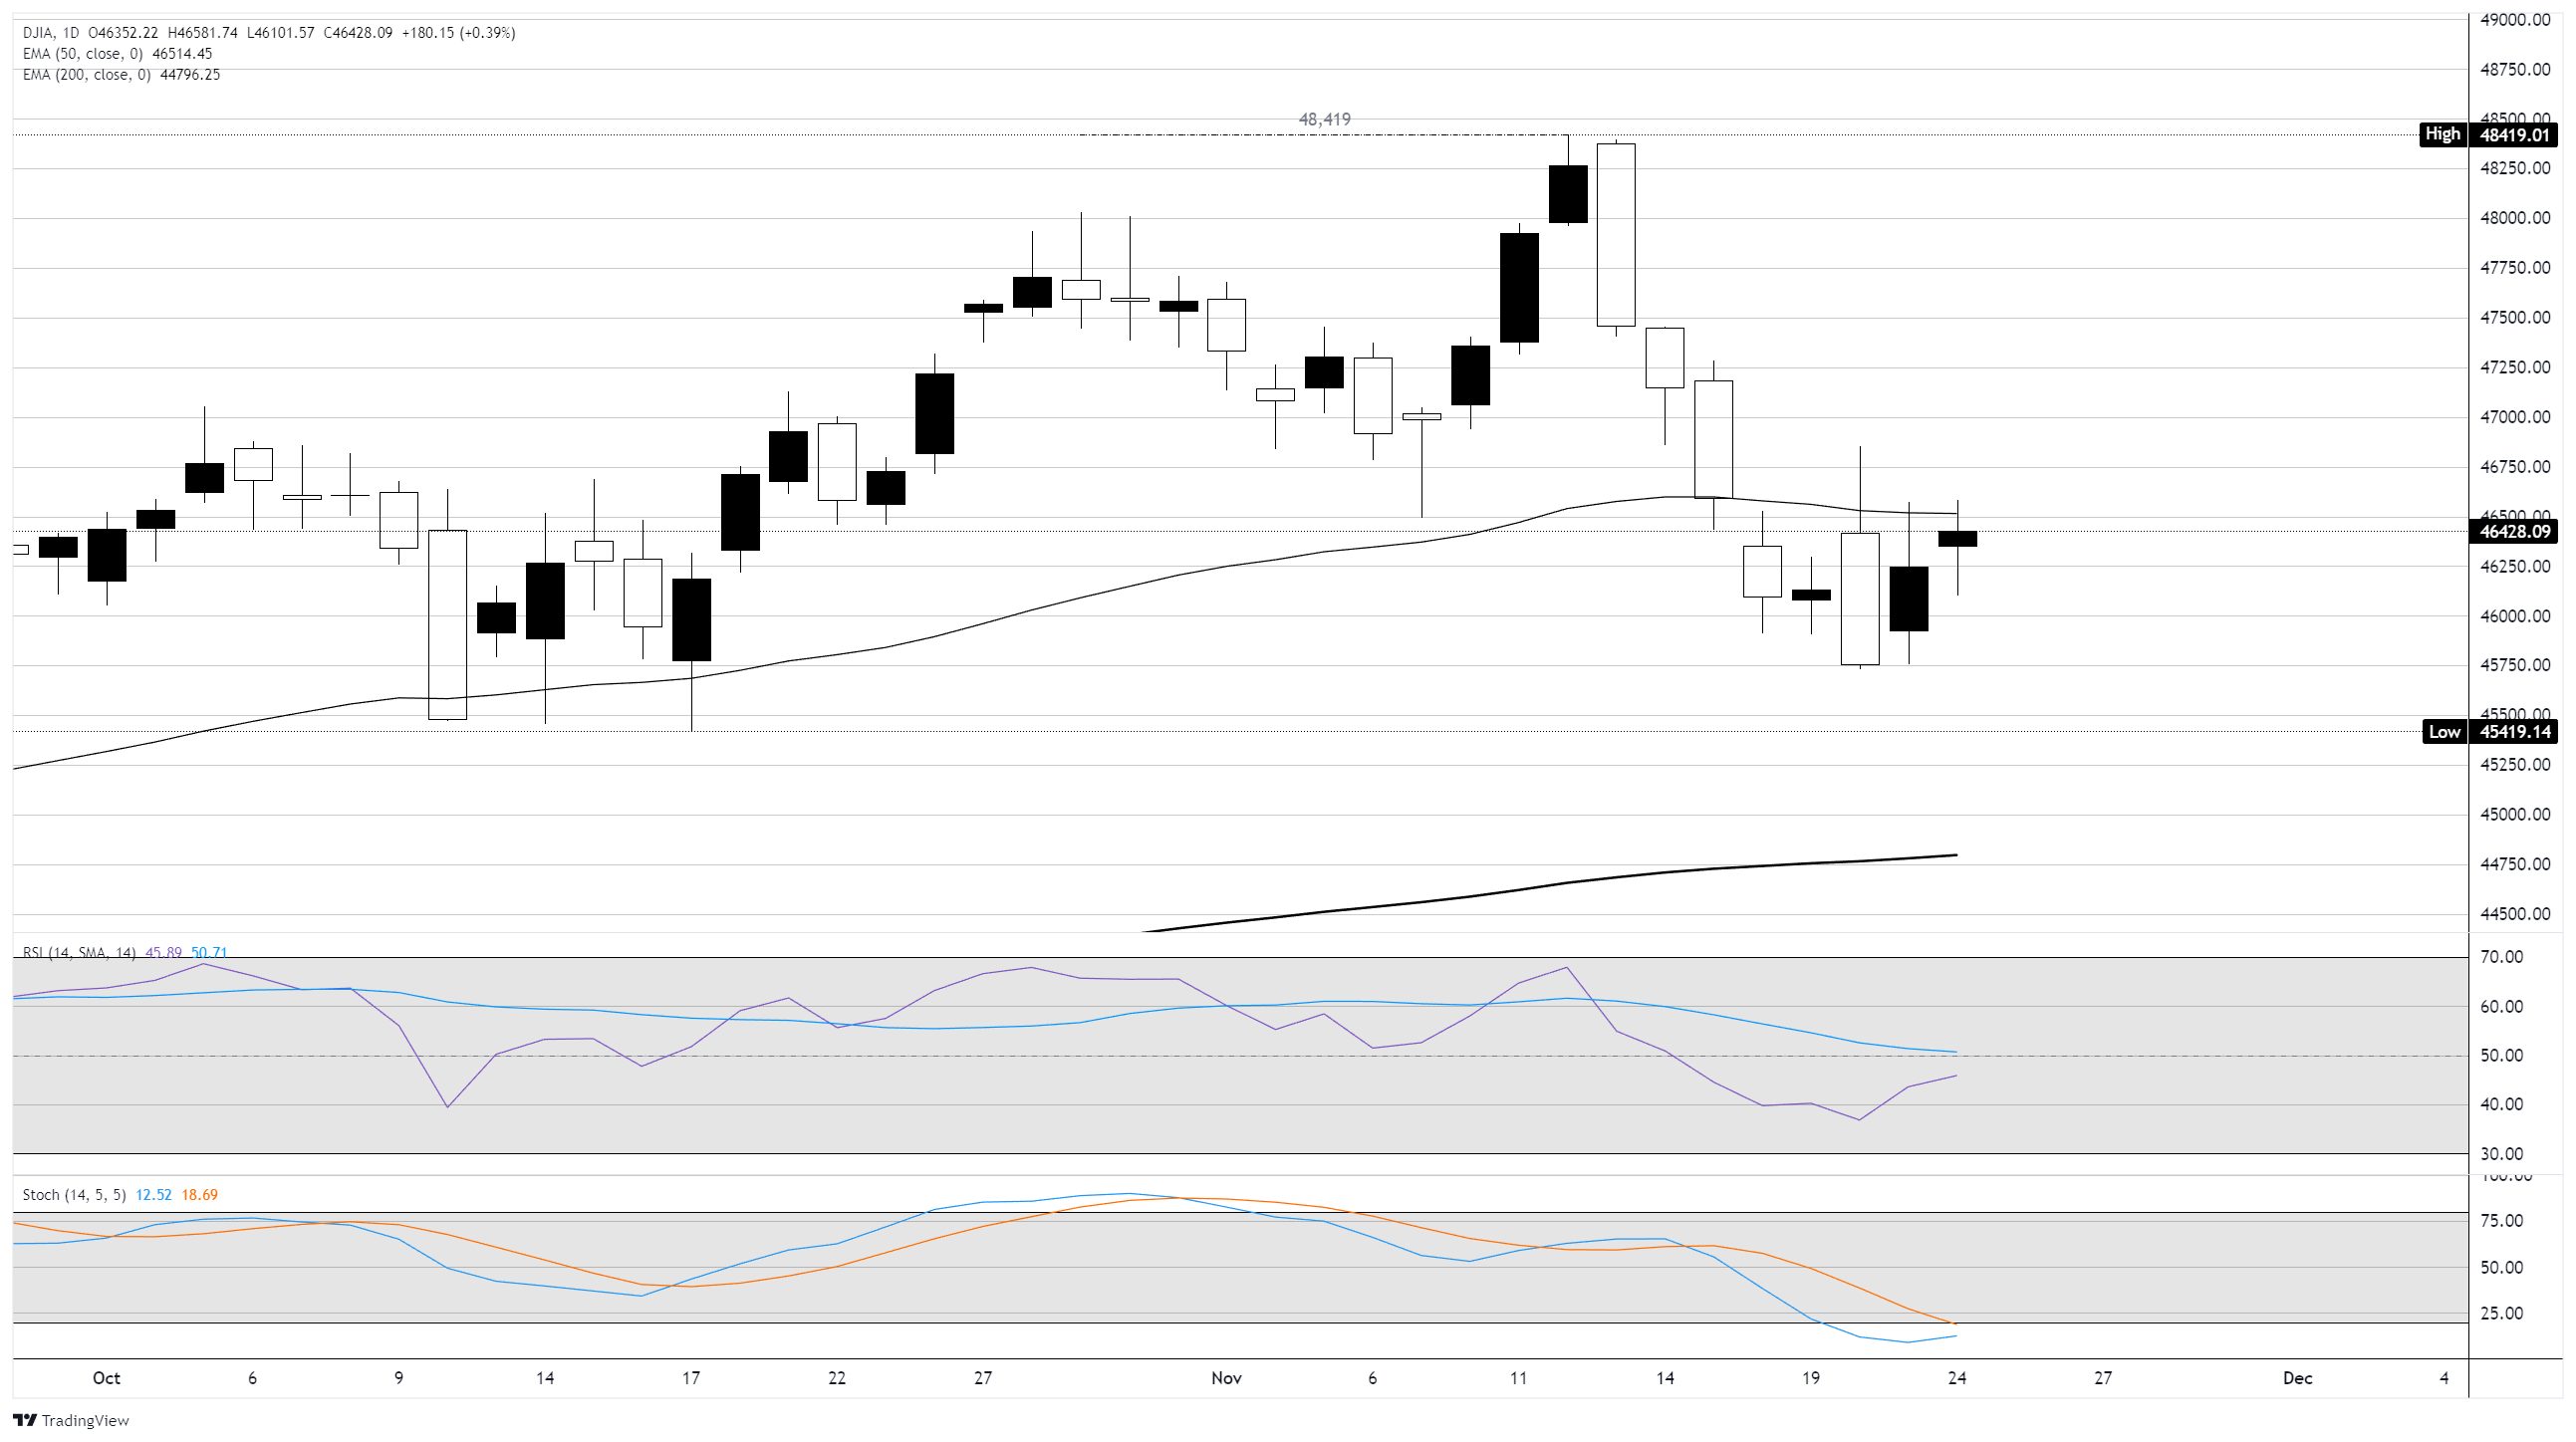
Dow Jones daily chart
Dow Jones FAQs
The Dow Jones Industrial Average, one of the oldest stock market indices in the world, is compiled of the 30 most traded stocks in the US. The index is price-weighted rather than weighted by capitalization. It is calculated by summing the prices of the constituent stocks and dividing them by a factor, currently 0.152. The index was founded by Charles Dow, who also founded the Wall Street Journal. In later years it has been criticized for not being broadly representative enough because it only tracks 30 conglomerates, unlike broader indices such as the S&P 500.
Many different factors drive the Dow Jones Industrial Average (DJIA). The aggregate performance of the component companies revealed in quarterly company earnings reports is the main one. US and global macroeconomic data also contributes as it impacts on investor sentiment. The level of interest rates, set by the Federal Reserve (Fed), also influences the DJIA as it affects the cost of credit, on which many corporations are heavily reliant. Therefore, inflation can be a major driver as well as other metrics which impact the Fed decisions.
Dow Theory is a method for identifying the primary trend of the stock market developed by Charles Dow. A key step is to compare the direction of the Dow Jones Industrial Average (DJIA) and the Dow Jones Transportation Average (DJTA) and only follow trends where both are moving in the same direction. Volume is a confirmatory criteria. The theory uses elements of peak and trough analysis. Dow’s theory posits three trend phases: accumulation, when smart money starts buying or selling; public participation, when the wider public joins in; and distribution, when the smart money exits.
There are a number of ways to trade the DJIA. One is to use ETFs which allow investors to trade the DJIA as a single security, rather than having to buy shares in all 30 constituent companies. A leading example is the SPDR Dow Jones Industrial Average ETF (DIA). DJIA futures contracts enable traders to speculate on the future value of the index and Options provide the right, but not the obligation, to buy or sell the index at a predetermined price in the future. Mutual funds enable investors to buy a share of a diversified portfolio of DJIA stocks thus providing exposure to the overall index.
Author

Joshua Gibson
FXStreet
Joshua joins the FXStreet team as an Economics and Finance double major from Vancouver Island University with twelve years' experience as an independent trader focusing on technical analysis.


