Dow Jones Industrial Average gets its rate relief and cannot hold it
- DJIA rallies roughly 450 points off its session low on the Federal Reserve hold, then hands back about 140 of them
- The rates market removed roughly 16 points of September hike probability and the index still trades more than 700 points beneath its session high.
- Three voting members dissented in favour of an immediate quarter-point increase, the first dissents of this chairmanship.

The Federal Reserve (Fed) held its target range at 3.50% to 3.75% at 18:00 GMT on a 9-3 vote, with three voting members preferring an immediate quarter-point increase. Equities got the outcome they wanted twice over, a hold on the day and a materially flatter path afterwards, and the index has already sold a third of the bounce. It trades near 52,100 against a session high in the 52,800 area.
The discount rate was not the problem
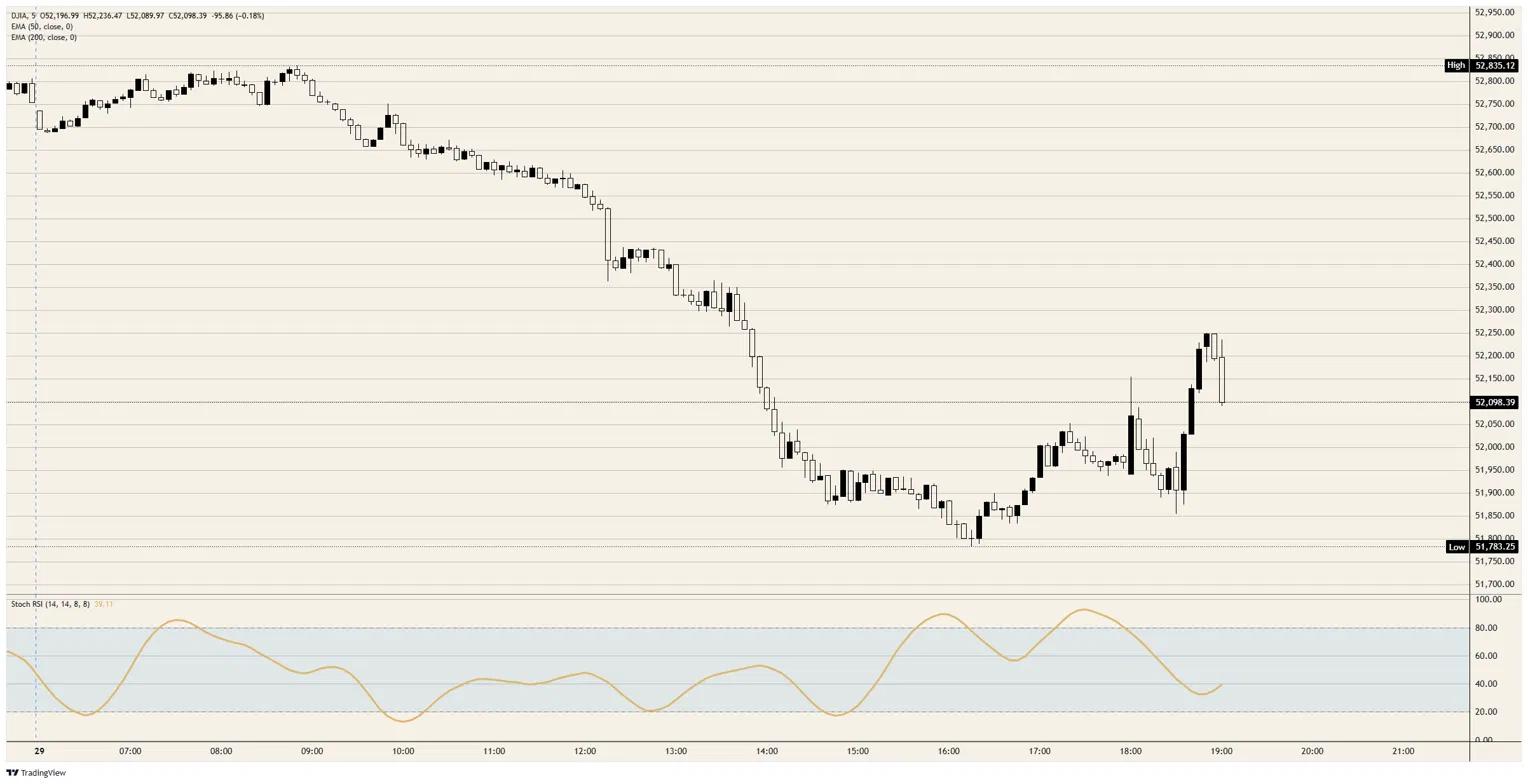
The slide that mattered happened before the decision, with the index running from the 52,800 area down to the 51,800 area by 16:15 GMT, better than 1,000 points and none of it Fed business. The bounce that followed recovered a little over 450 points of that and is fading in real time. Two hours of policy relief have not repaired one session of selling.
A discount-rate shock is the one scheduled event that hits every index constituent identically, which is exactly why a dovish repricing of this size should have been worth more to a tape that had just lost a thousand points. It was not. What has been setting this range is the chip complex, the earnings calendar and the single-name damage of the past fortnight, none of which the front end can fix.
A flatter path that nobody validated
The repricing itself is substantial and worth stating plainly. At least one increase by September 16 now prices near 64% against roughly 80% on the captures taken before the meeting: October near 75%, and December near 85%. The probability of at least two increases by December 9 has dropped to roughly 42% from 57%, and the most likely December outcome is now one step rather than two.
That easing came out of the briefing rather than the statement, which read hawkish on every measure that scores such things. The Chair repeated that the committee has no tolerance for persistently elevated inflation and would not hesitate to act, then made clear that the committee is not in the forecasting business and will not be signaling its next move. Three dissents with no reaction function attached are a headline rather than a hike.
The statement did something new besides holding, naming the Middle East conflict as a source of the uncertainty and energy as a driver of the price increases the Committee is looking through. For an index that has spent five months treating the chokepoint as somebody else's problem, having the central bank write the war into its inflation paragraph is a change in the official story. The tape has not treated it as one yet.
Relief priced, not banked
An equity market that fades its own good news within thirty minutes is telling on itself. The index took the flatter path, ran it into the 52,250 area, and then found no second buyer at a level more than 500 points beneath where the session opened. That is a tape trading the denominator while the numerator deteriorates.
The uncomfortable read is that a lower policy path is worth less to this index than the market assumed going in, because the damage of the past fortnight has been idiosyncratic rather than macro. Correlation near single digits means the index inherits only a fraction of the churn beneath it, and a Fed that declines to generate correlation leaves every constituent to answer for itself.
What the index has to clear this week
Thursday at 12:30 GMT brings the June Personal Consumption Expenditures price index, with the core measure seen at 0.2% MoM and 3.3% YoY against 0.3% and 3.4% prior, alongside preliminary second-quarter Gross Domestic Product at 2.1% and initial jobless claims at 200K from a 187K prior. Friday adds the second-quarter Employment Cost Index at 0.8% and the Michigan inflation expectations series, with the one-year reading seen unchanged at 4.2%.
Earnings remain the larger risk to the range. Index members still report before the week is out, and on the evidence of the past fortnight a single result is worth more points to this structure than a full repricing of the September meeting. The macro calendar decides the discount rate and the reporting calendar decides the level.
Levels
Resistance: The 52,250 area capped the post-decision bounce and is the first level to reclaim. Above it the 52,600 area is the ceiling that failed on 27 July, with the session high in the 52,800 area beyond that.
Support: The 52,000 handle is the immediate shelf, with the 51,800 area beneath it marking the session low. A break there exposes the 50-day exponential moving average near 51,500.
Bias: Bearish. A bounce that surrenders a third of itself within half an hour of the catalyst that caused it is a selling opportunity, with objectives at the 52,000 handle and then the 51,800 area, invalidation on a daily close back above 52,600.
Dow Jones 5-minute chart
Dow Jones FAQs
The Dow Jones Industrial Average, one of the oldest stock market indices in the world, is compiled of the 30 most traded stocks in the US. The index is price-weighted rather than weighted by capitalization. It is calculated by summing the prices of the constituent stocks and dividing them by a factor, currently 0.152. The index was founded by Charles Dow, who also founded the Wall Street Journal. In later years it has been criticized for not being broadly representative enough because it only tracks 30 conglomerates, unlike broader indices such as the S&P 500.
Many different factors drive the Dow Jones Industrial Average (DJIA). The aggregate performance of the component companies revealed in quarterly company earnings reports is the main one. US and global macroeconomic data also contributes as it impacts on investor sentiment. The level of interest rates, set by the Federal Reserve (Fed), also influences the DJIA as it affects the cost of credit, on which many corporations are heavily reliant. Therefore, inflation can be a major driver as well as other metrics which impact the Fed decisions.
Dow Theory is a method for identifying the primary trend of the stock market developed by Charles Dow. A key step is to compare the direction of the Dow Jones Industrial Average (DJIA) and the Dow Jones Transportation Average (DJTA) and only follow trends where both are moving in the same direction. Volume is a confirmatory criteria. The theory uses elements of peak and trough analysis. Dow’s theory posits three trend phases: accumulation, when smart money starts buying or selling; public participation, when the wider public joins in; and distribution, when the smart money exits.
There are a number of ways to trade the DJIA. One is to use ETFs which allow investors to trade the DJIA as a single security, rather than having to buy shares in all 30 constituent companies. A leading example is the SPDR Dow Jones Industrial Average ETF (DIA). DJIA futures contracts enable traders to speculate on the future value of the index and Options provide the right, but not the obligation, to buy or sell the index at a predetermined price in the future. Mutual funds enable investors to buy a share of a diversified portfolio of DJIA stocks thus providing exposure to the overall index.
Author

Joshua Gibson
FXStreet
Joshua joins the FXStreet team as an Economics and Finance double major from Vancouver Island University with twelve years' experience as an independent trader focusing on technical analysis.

















