Dow Jones Industrial Average fell on Wednesday amid renewed tariff threats
- The Dow Jones shed around 200 points on Wednesday.
- Fresh tariff threats from US President Trump, but the can has been kicked again.
- Tech sector its faces next challenge in Nvidia earnings due after the bell.

The Dow Jones Industrial Average (DJIA) missed out on slim gains found by other US equity indexes, backsliding around 200 points as investors remain uneasy in the face of renewed tariff threats from US President Donald Trump. Upcoming earnings figures from AI frontrunner Nvidia (NVDA) are also due during the overnight session after the market close on Wednesday, and pose the next bump in the road for the tech sector rally that has fizzled in recent weeks.
Read more: US President Donald Trump widens scope of tariffs, but pushes back timeline
Never one to miss an opportunity, President Trump hit markets with renewed tariff threats on Wednesday. He widened the scope of his planned import taxes to include a 25% tariff on European goods. Details remain elusive, but President Trump announced his intention to impose additional tariffs on European goods, including “cars and other things.” Donald Trump also re-reiterated his insistence that the US does not “need” Canadian Crude Oil or lumber, and that 25% tariff packages on both Canada and Mexico are still coming. However, President Trump once again kicked the can, declaring that his for-sure tariffs on Canada and Mexico will now be taking effect on April 2nd.
Dow Jones news
Nvidia has risen around 2% on Wednesday in the runup to its post-market Q4 earnings report, but bidders in the AI rally are still holding on tight for year-end results from 2024. As one of the frontrunners in the tech ecosystem that has sprouted up around delivering data solutions to AI services, Nvidia earnings could be a make-or-break bellwether of what kind of year the AI tech rally could be looking at. Market expectations of earnings on the back of AI-fueled growth have moonshot over the past year, with investors dissatisfied with anything less than triple-digit profit growth. Nvidia was last seen trading near $360 per share.
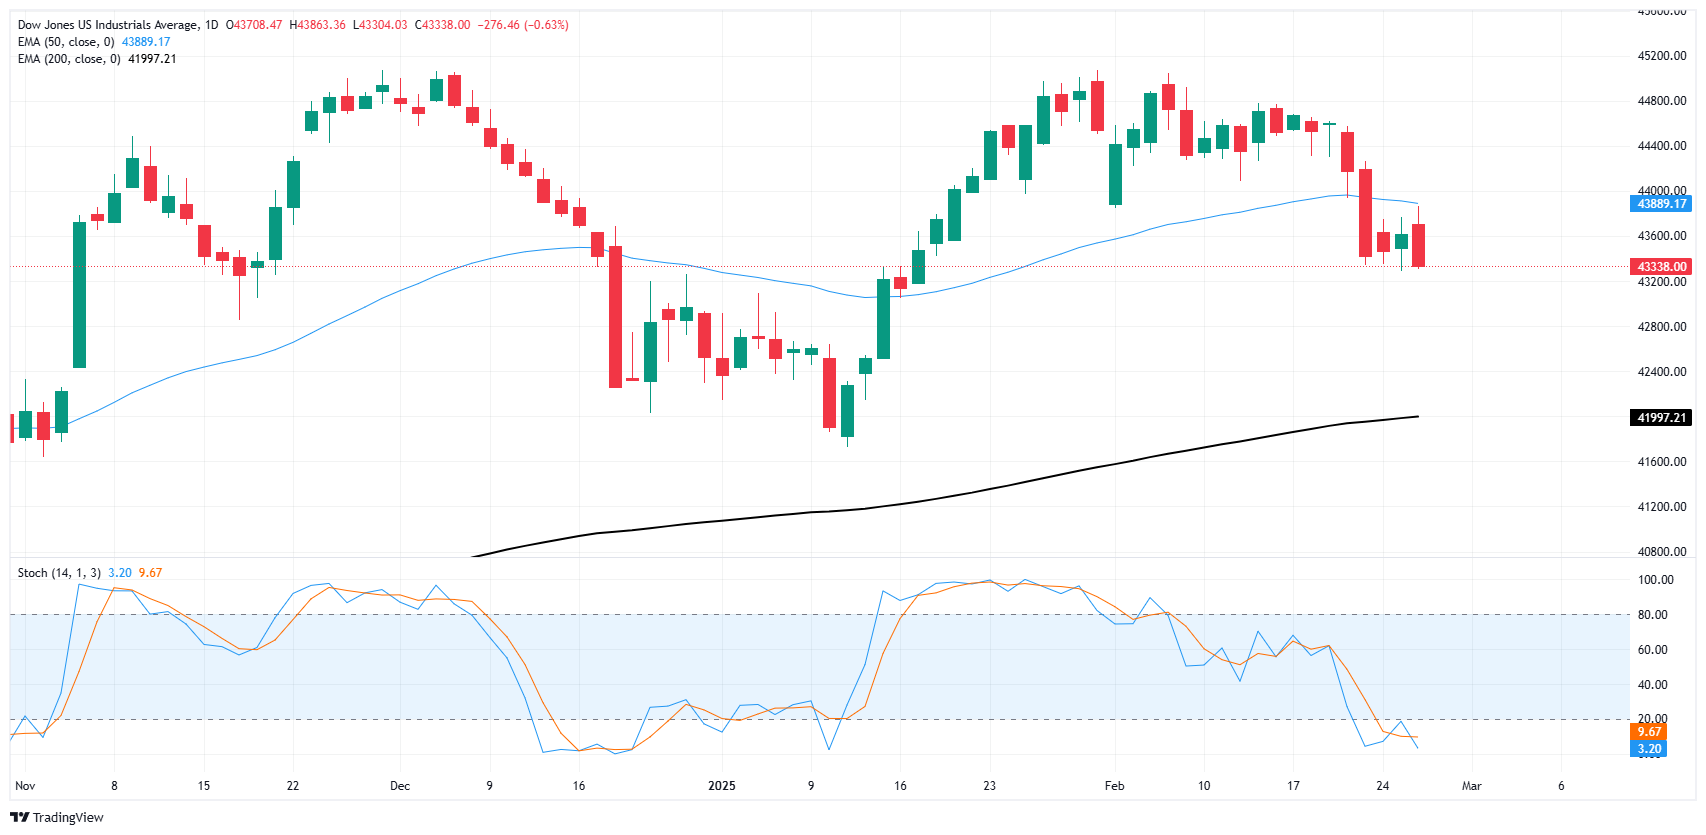
Dow Jones price forecast
The Dow Jones hit a three-day high near 43,860 early on Wednesday before the major equity index got knocked lower, chalking in a fresh technical rejection of the 50-day Exponential Moving Average (EMA) in the process. The Dow is still trading within a near-term consolidation pattern that kicked off with last Friday’s sharp downside correction, but a technical floor appears to be priced in from 43,200.
Dow Jones daily chart
Dow Jones FAQs
The Dow Jones Industrial Average, one of the oldest stock market indices in the world, is compiled of the 30 most traded stocks in the US. The index is price-weighted rather than weighted by capitalization. It is calculated by summing the prices of the constituent stocks and dividing them by a factor, currently 0.152. The index was founded by Charles Dow, who also founded the Wall Street Journal. In later years it has been criticized for not being broadly representative enough because it only tracks 30 conglomerates, unlike broader indices such as the S&P 500.
Many different factors drive the Dow Jones Industrial Average (DJIA). The aggregate performance of the component companies revealed in quarterly company earnings reports is the main one. US and global macroeconomic data also contributes as it impacts on investor sentiment. The level of interest rates, set by the Federal Reserve (Fed), also influences the DJIA as it affects the cost of credit, on which many corporations are heavily reliant. Therefore, inflation can be a major driver as well as other metrics which impact the Fed decisions.
Dow Theory is a method for identifying the primary trend of the stock market developed by Charles Dow. A key step is to compare the direction of the Dow Jones Industrial Average (DJIA) and the Dow Jones Transportation Average (DJTA) and only follow trends where both are moving in the same direction. Volume is a confirmatory criteria. The theory uses elements of peak and trough analysis. Dow’s theory posits three trend phases: accumulation, when smart money starts buying or selling; public participation, when the wider public joins in; and distribution, when the smart money exits.
There are a number of ways to trade the DJIA. One is to use ETFs which allow investors to trade the DJIA as a single security, rather than having to buy shares in all 30 constituent companies. A leading example is the SPDR Dow Jones Industrial Average ETF (DIA). DJIA futures contracts enable traders to speculate on the future value of the index and Options provide the right, but not the obligation, to buy or sell the index at a predetermined price in the future. Mutual funds enable investors to buy a share of a diversified portfolio of DJIA stocks thus providing exposure to the overall index.
Author

Joshua Gibson
FXStreet
Joshua joins the FXStreet team as an Economics and Finance double major from Vancouver Island University with twelve years' experience as an independent trader focusing on technical analysis.


