|

Dollar Index (DXY) rallied from our equal legs zone

In this technical article we’re going to take a quick look at the Elliott Wave charts of Dollar Index (DXY) published in members area of the website.

As our members know, DXY made a pullback that unfolded as an Elliott Wave Zig Zag pattern. Price completed a clear 3-wave move down from the peak and found support at the Equal Legs zone (buying area). In the following analysis, we explain the Elliott Wave pattern and the market outlook.

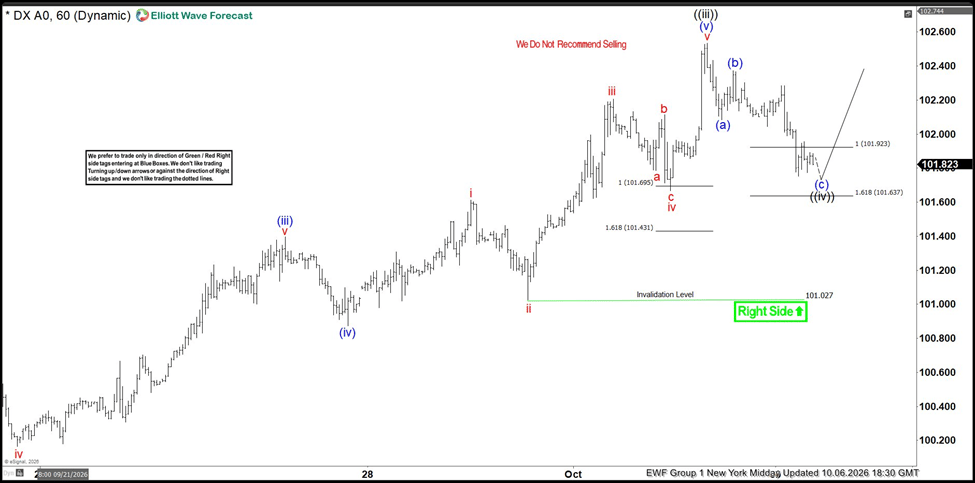
DXY Elliott Wave one hour chart 10.06.2026

Dollar Index is currently forming an intraday three-wave pullback from the recent highs. We identified a potential buying zone by measuring the Equal Legs area with the Fibonacci Extension tool, projecting the length of wave (a) from the end of wave (b). The ideal support area comes at 101.92–101.63 ( buying zone) . As long as price holds above this region, buyers could step in and support another move higher, with the potential for the Index to resume its rally toward new highs.
Chart

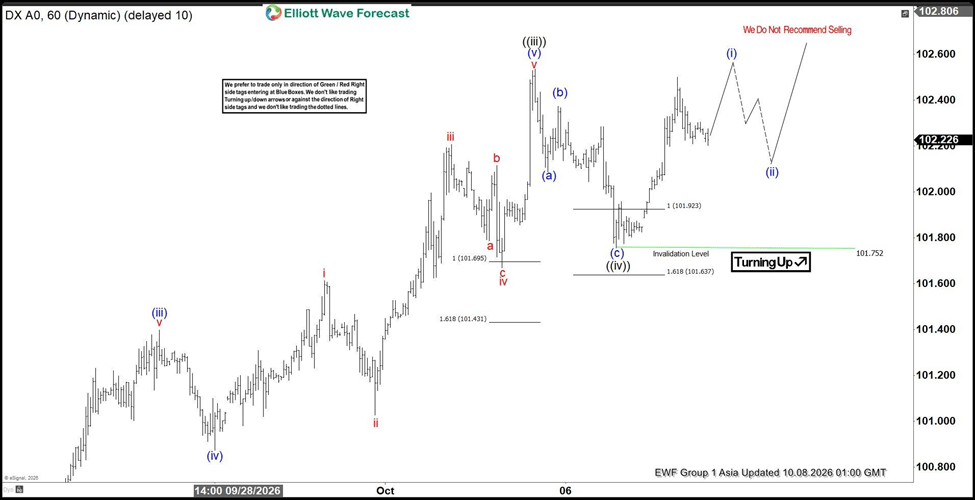
DXY Elliott Wave one hour chart 10.08.2026

Dollar Index found buyers at the Equal Legs zone, as expected. The correction ended at the 101.75 low, and DXY has since started a rally from that area. The reaction confirms the buying zone was respected, and the bullish sequence is now progressing higher. As a result, long positions taken from the Equal Legs zone can now be considered risk-free after moving the stop to breakeven, while the Index continues to target further upside. As long as the 101.75 pivot holds, Dollar Index can continue higher toward the 102.71–103.01 target area.

Important note: Our analysis is not based on Elliott Wave in isolation. We perform detailed higher-time-frame cycle analysis, which shows an incomplete market structure. This is one of the key drivers of price action, along with correlation analysis and broader market context.
Chart

Author

Elliott Wave Forecast Team

Elliott Wave Forecast Team

ElliottWave-Forecast.com

More from Elliott Wave Forecast Team
Share:

Editor's Picks

AUD/USD bulls regain control above 0.6950 amid USD retreat

AUD/USD regains traction and extends the previous day's bounce from the weekly low, aiming for 0.7000 in Asia on Friday. The overnight pullback in US bond yields keeps the US Dollar below an 18-month high, which in turn offers some support to the pair. Meanwhile, hawkish RBA expectations also keep the major underpinned.

USD/JPY holds gains near 158.00 after Japan's weak Household Spending data

USD/JPY clings to gains around 158.00 after data showed on Friday that Japan's Household Spending fell for the ninth straight month, undermining the Japanese Yen. Meanwhile, the US Dollar remains depressed as the overnight fall in US bond yields counters a hawkish Fed and geopolitical uncertainties, could cap any downside in the pair.

Gold remains range-bound below $4,200

Gold has given up some ground after an initial bullish attempt to reach weekly highs, returning to below the $4,200 mark per troy ounce on Friday. The US Dollar’s strong upside momentum, combined with rising US Treasury yields across the curve, seems to keep further gains in the yellow metal under scrutiny.

Has Bitcoin really escaped the macro forces it was built to fight?
Over 17 years ago, Satoshi Nakamoto designed Bitcoin (BTC) on the back of a global financial crisis as an alternative to the global monetary system outside the control of central banks, governments and traditional intermediaries. This raises a key question: has Bitcoin really become independent of the macroeconomic forces it was built to challenge?
The Euro is not the sick man of Europe. France's bond market is
EUR/USD remains under pressure, near the 17-month low of 1.1161 reached on Monday. The pair has lost more than 7% since its yearly peak, as concerns over France's public finances increasingly weigh on the single currency. But behind the weakness of the Euro (EUR), the problem does not necessarily lie with the European economy as a whole.
Has Bitcoin really escaped the macro forces it was built to fight?
Over 17 years ago, Satoshi Nakamoto designed Bitcoin (BTC) on the back of a global financial crisis as an alternative to the global monetary system outside the control of central banks, governments and traditional intermediaries. This raises a key question: has Bitcoin really become independent of the macroeconomic forces it was built to challenge?















