|premium|

Disney (DIS Stock) hit first target +18.58% return In 12 days, now what?

Since the crash of March 2020, all stocks have tried to recover what they lost and Disney was no exception. Disney did not only recover the lost, but It also reached historic highs. Now, we are going to try to build an impulse from the March 2020 lows with a target around $230. Target measured from 0 to 2019’s high projected from March’s low, equal legs.

Disney Daily Chart

DIS

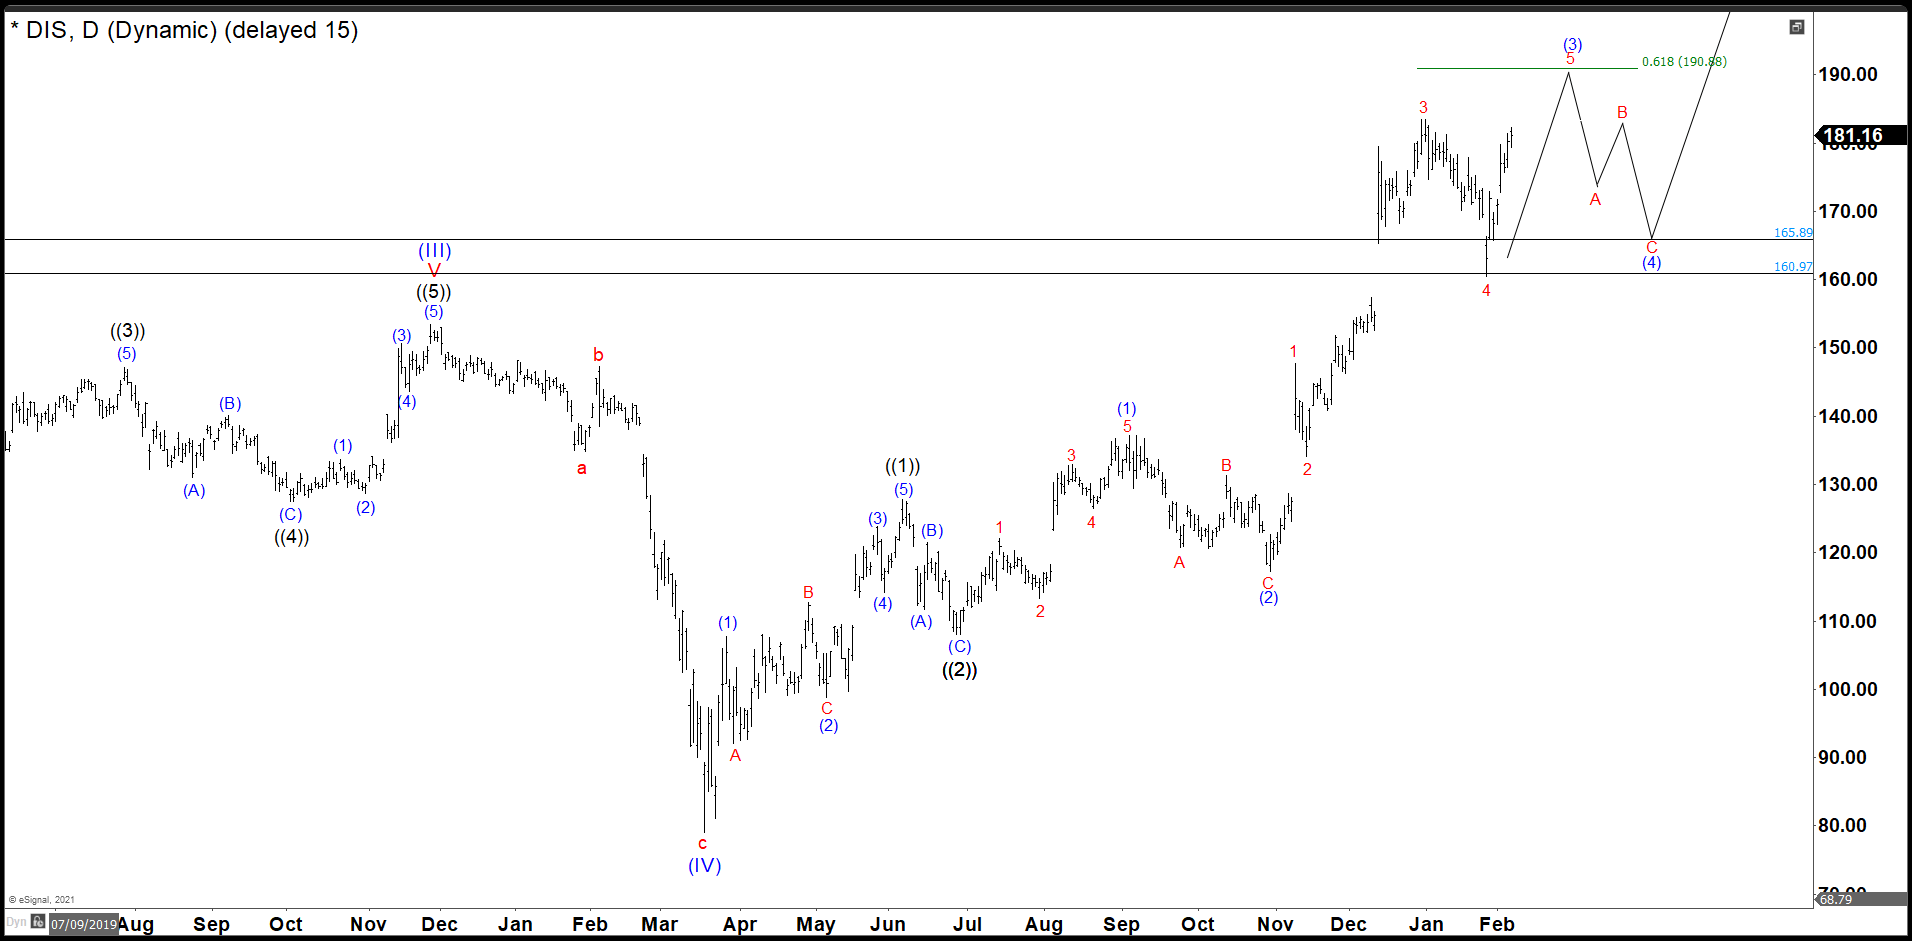
As we see in the daily chart, the waves ((1)) and ((2)) of the impulse have completed and currently we are building the wave ((3)). We believe that wave (3) of ((3)) is still developing and we need one more high to complete an impulse 1, 2, 3, 4, 5 in red. We expect that the wave 5 in red reaches 190.88, ideally, to end the structure of wave (3) of ((3)).

DIS

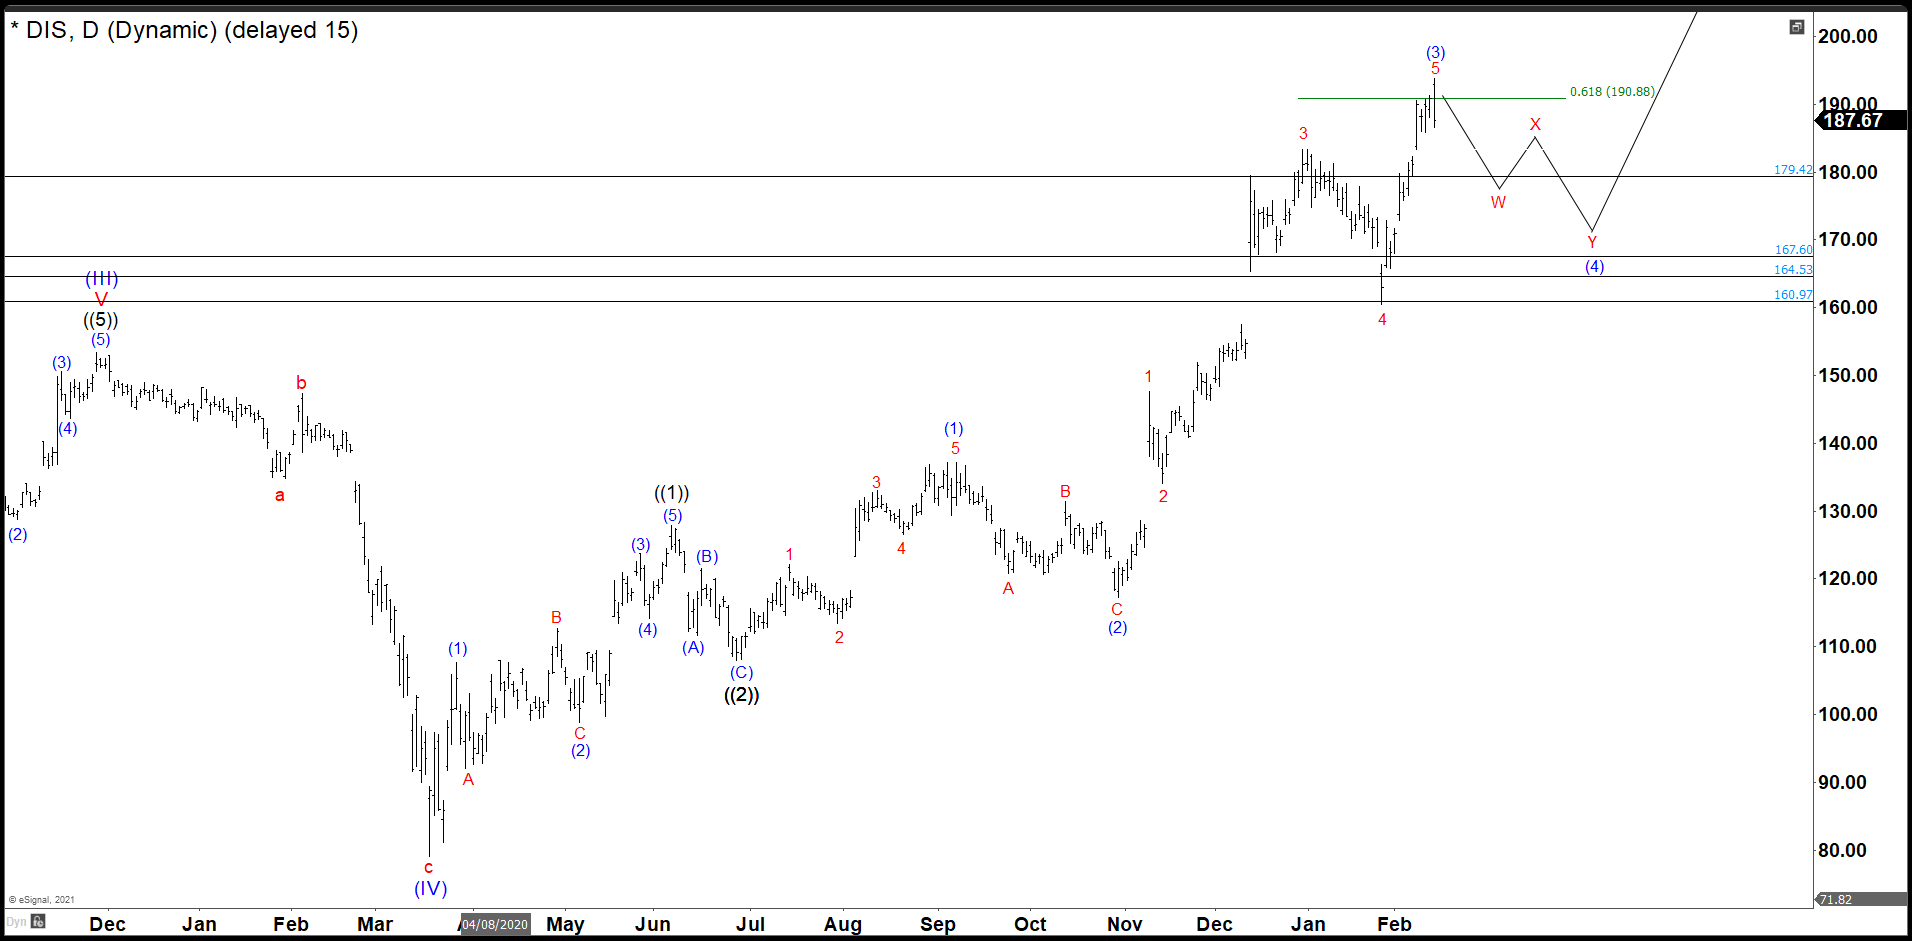
Last week we expected to continue higher as an impulse to complete the structure of the wave (3). On Monday the market broke to a new historical high and reached the first target at 190.88 after hours and continued higher to peak at 198.77. The target gave us a return of +18.58% from 160.97. We believe that 198.77 is the end of the wave (3) of ((3)) and wave (4) of ((3)) began to build. The area to watch to complete this wave (4) is between 179.42 –" 167.60 where we must continue the rally to find out a new historical high and complete the wave (5) of ((3)).

Disney 30 minutes Chart

DIS

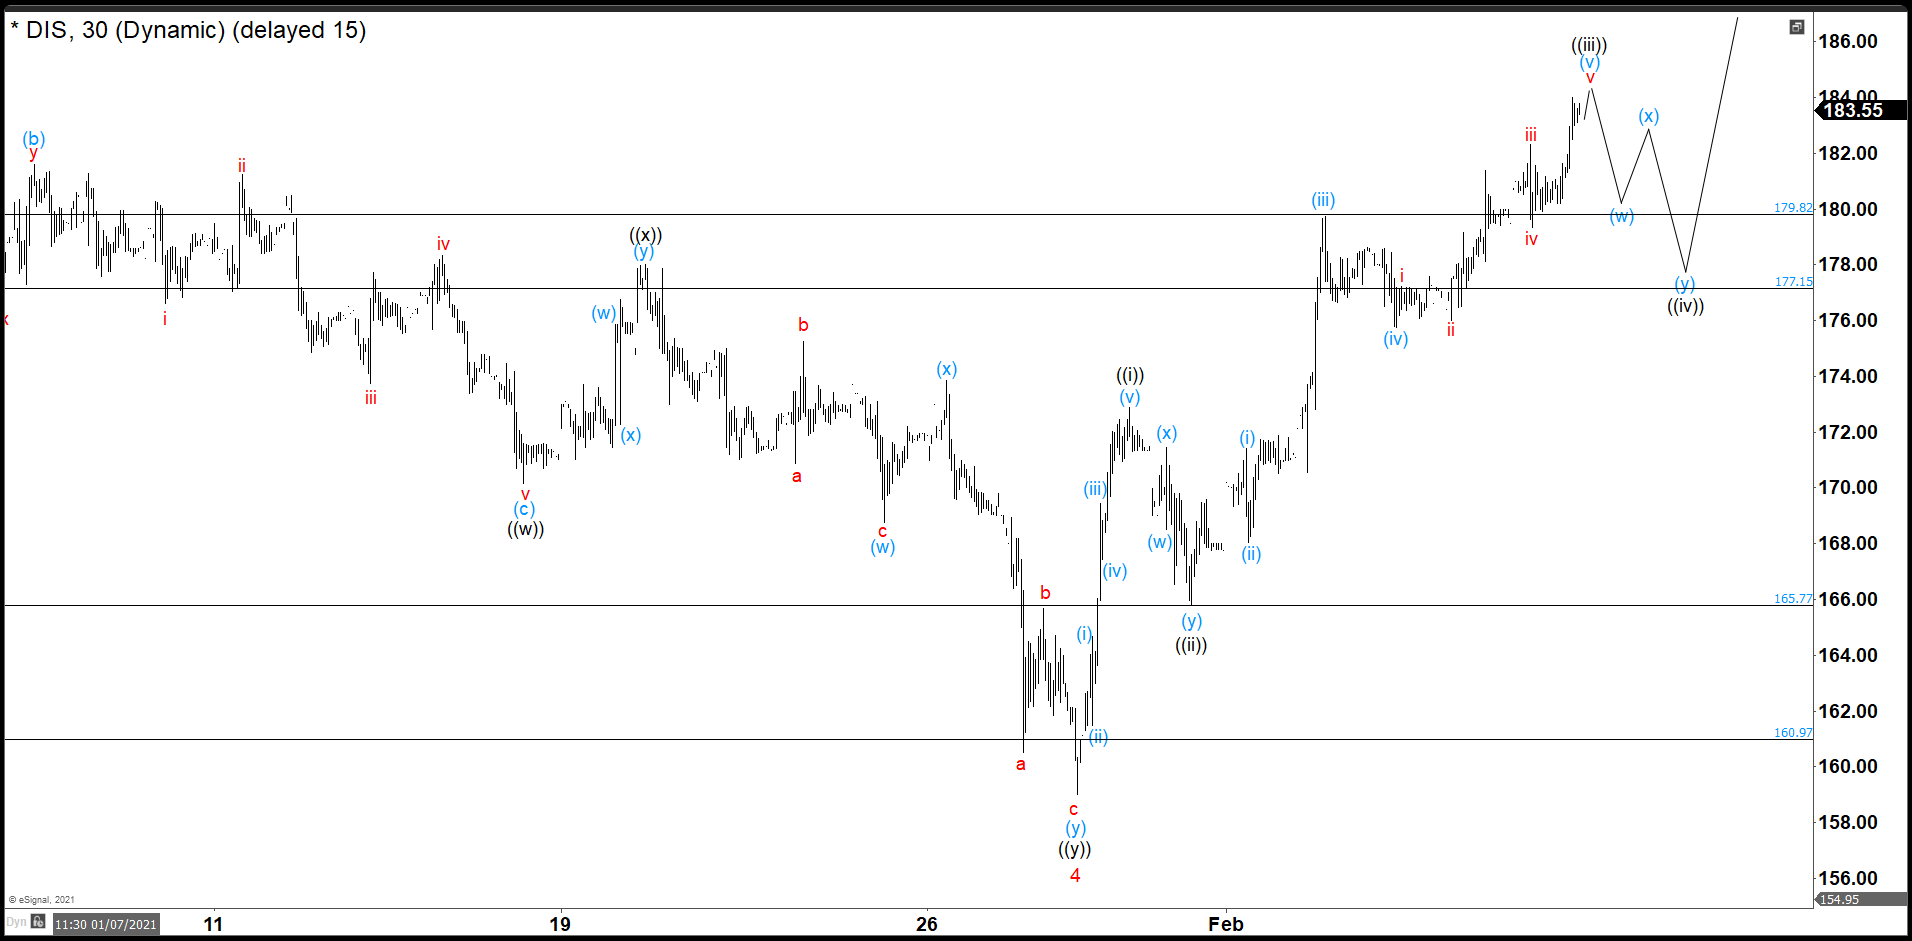
In this chart, we expected a slightly high to complete an extended wave (v) and also wave ((iii)), but the market continues higher and extended even more until 191.54 where wave ((iii)) finished.

DIS

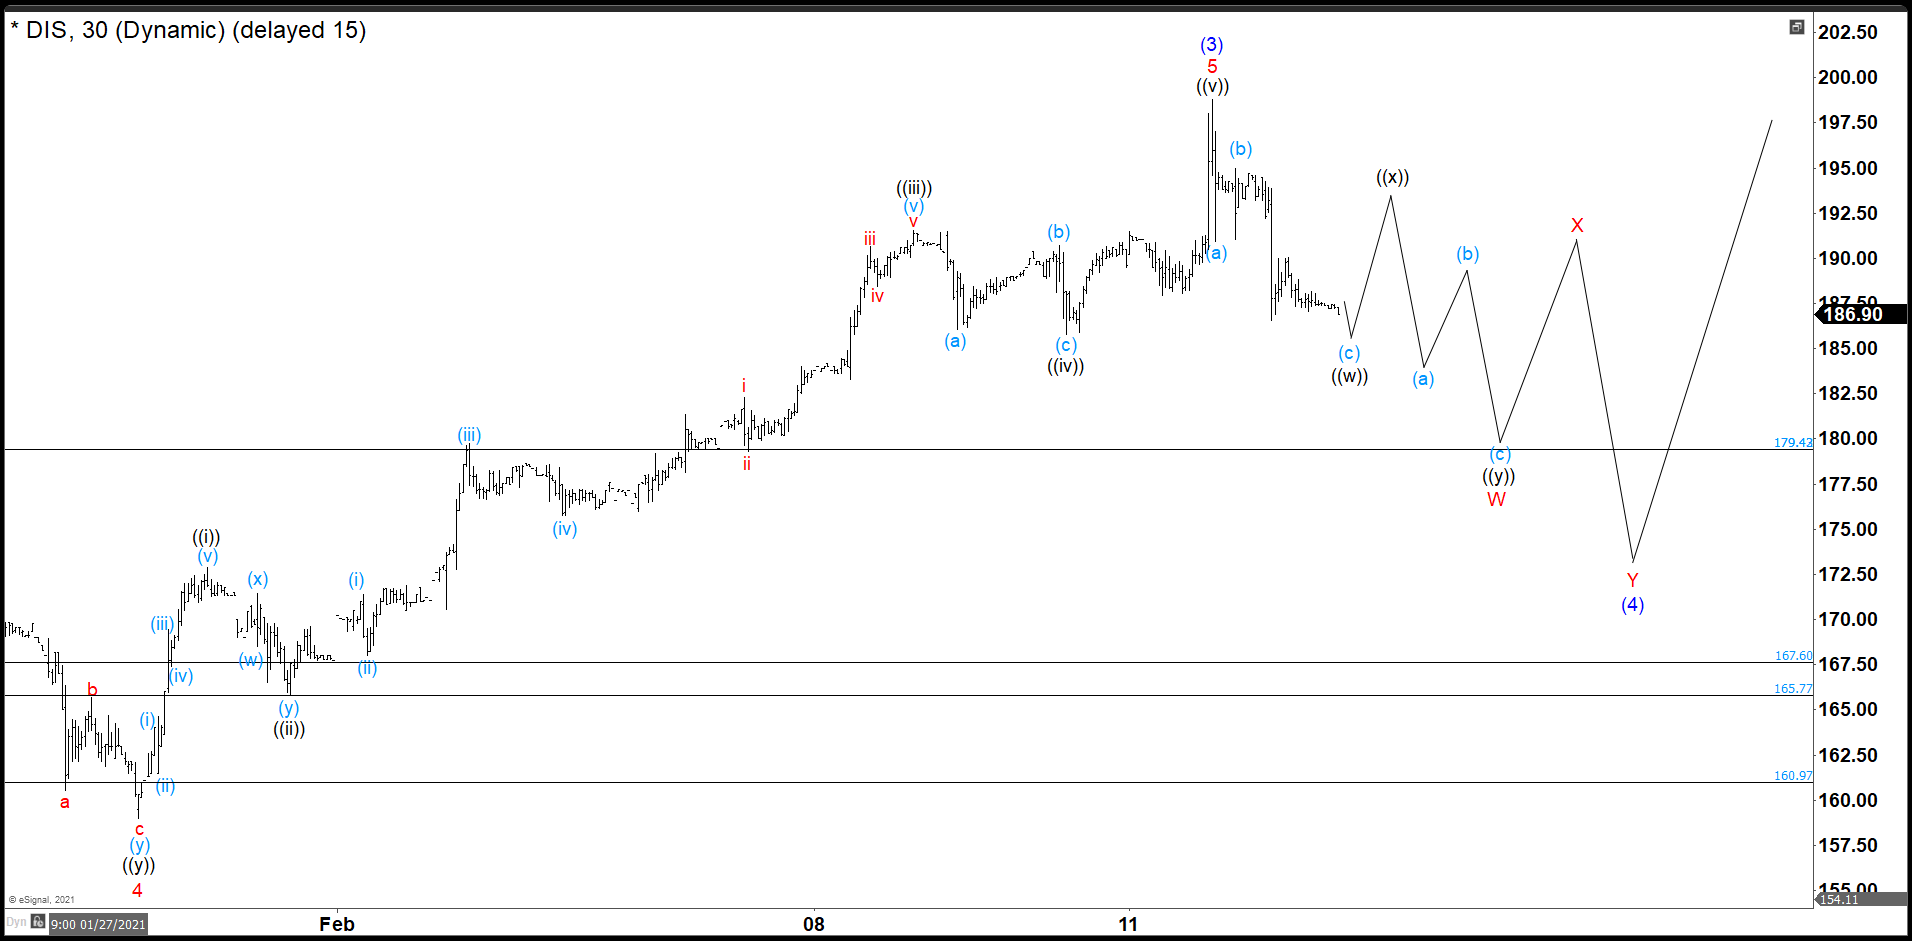
Then we corrected as a flat structure (a), (b), and (c) to end wave ((iv)) of 5, and finally rally to 198.77 to complete wave 5 of (3) and wave (3). From here, Disney began to drop and it should develop the wave (4). We already have seen 3 swings down and we expect get down a little more to complete ((w)). Then a corrective rally in other 3 swings to build ((x)) to continue the drop in the next week.

Premium

You have reached your limit of 3 free articles for this month.

Start your subscription and get access to all our original articles.

Subscribe to PremiumSign In

Author

Elliott Wave Forecast Team

Elliott Wave Forecast Team

ElliottWave-Forecast.com

More from Elliott Wave Forecast Team
Share:

Editor's Picks

AUD/USD falls to near 0.7100 after slipping below 50-day EMA

AUD/USD depreciates after registering minor gains in the previous day, trading around 0.7120 during the Asian hours. The technical analysis of the daily chart shows the pair consolidating sideways within a rectangle pattern, as neither bulls nor bears gain control. The AUD/USD pair is holding a slight bearish tone however as it sits beneath both the nine-day and 50-day EMAs.

160.00: USD/JPY back near intervention territory after upbeat US jobs report

US Nonfarm Payrolls beat expectations by a wide margin in May, with 172K jobs added. The US Dollar rebounds after the release, helping USD/JPY recover from its intraday lows. Warnings from Japanese authorities continue to limit upside potential near the 160.00 threshold.

Gold targets $4,300 amid stronger Dollar

Gold faces increasing selling interest and navigates the area of three-month lows near the $4,300 mark per troy ounce on Friday. The precious metal’s decline comes as traders assess the stronger-than-expected NFP, while the bid bias in the Greenback and higher US Treasury yields also collaborate with the retracement.

Cardano hits five-year low even as Hoskinson clarifies "break" isn't an exit

Cardano (ADA) price is down 10% at press time on Friday, extending losses over 30% so far this week amid Charles Hoskinson's clarification that "break" isn't an exit.

Week ahead – Fed countdown begins amid US inflation data and geopolitical risks

Fed Chair Warsh’s first meeting approaches as key US inflation data could reshape expectations. Oil prices remain elevated as US-Iran talks continue; tariffs also return to the spotlight. ECB is expected to hike; will it be a one-off move or is July live?

The US economy defies the rules: 100 days into the Oil shock and the recession signal is still missing

More than three months after the start of the Iran war and the resulting disruption to global energy markets, the US economy continues to display remarkable resilience. The conflict has triggered a sharp rise in Oil prices, reignited inflationary pressures and fueled widespread concerns about a potential economic slowdown.