Did the NASDAQ100 put in a major top?

In our previous update from two weeks ago, when the NASDAQ100 (NDX) was trading at $19000, we found that
“contingent on holding above last week’s low, we should allow the index to rally to ideally $19350+/-125.”
Over the next several days, it topped out when the FED announced its interest rate decision on Wednesday, September 18, at $19643 and dropped to $19330. So far, so good. However, the market decided it did not have enough, closing the July gap at $20200 yesterday. See Figure 1 below. The question now is, “Was that all she wrote?”
Figure 1. NDX daily chart with detailed Elliott Wave count and technical indicators
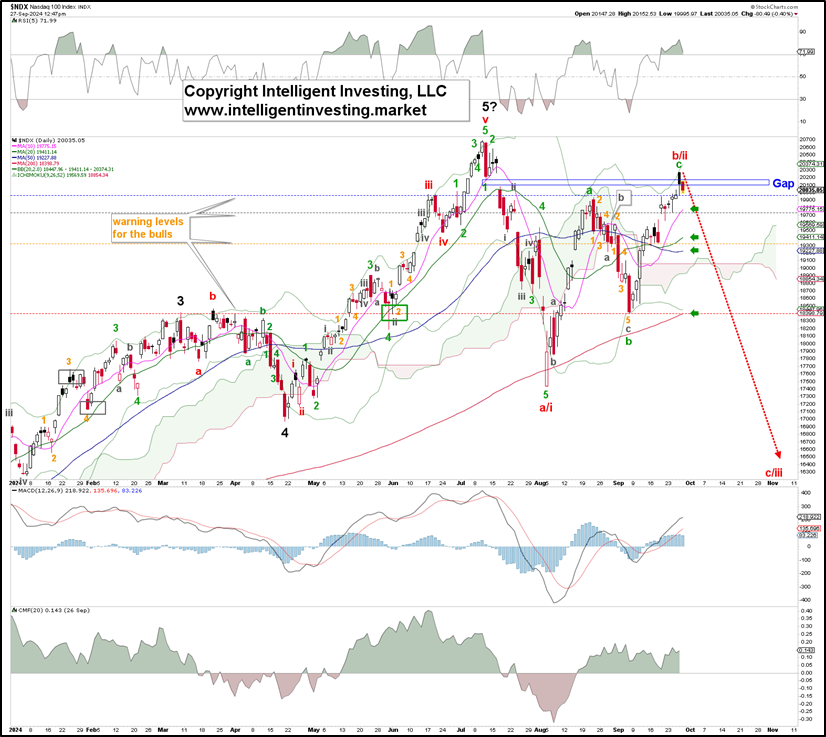
To answer that question, we must objectively assess the market from several perspectives, such as price patterns (e.g., higher highs and lows vs. lower highs and lows), price trends (up vs. down), Elliott Wave Principle (EWP) counts, and technical indicators.
- First, the rally from the September low decided to subdivide, and we have adjusted the EWP accordingly. Remember, all we can do is “anticipate, monitor, and adjust” when forecasting the markets, which are complex systems. Regardless, the index never broke below any of our (colored) warning levels for the Bulls, which we adjust daily for our premium members to keep them on the right side of the market for as long as possible. Thus, we stayed the course. These warning levels have consistently been raised since our last update, and the first one (blue) now resides at yesterday’s low. Consider it a “radar lock”. The 2nd (grey) warning for the Bulls is $19750, around last Thursday’s and this Monday’s low. That’s the “shot across the bow.” Etc. These levels tell us that the chances of further upside diminish with each breach. Below the 4th (red) warning level, it’s “game over.” For now, it is still higher highs and lows.
- Second, without a breach of any of these levels, the EWP count shown is still only a possibility. It will serve us well when confirmed, as we then know what more significant wave (the red W-c/iii) the index is in, but at this stage, we cannot be sure just yet. That’s fine, as we let the market guide our trades and never front-run.
- Third, the index is above its rising 10-day Simple Moving Average (d SMA), which is above the rising 20d SMA, the rising 50d SMA, and the increasing 200d SMA (green arrows)—a 100% Bullish chart. Besides, the NDX is also above its rising Ichimoku Cloud. This is another line of evidence telling us the current trend is still up.
- Lastly, all the technical indicators are still positive. The daily RSI5 is >70. The MACD points higher and had a buy cross in early September, whereas the money flow (CMF) is also positive.
The bottom line is that the EWP should not be used in a vacuum. Indeed, it can suggest the NDX may have formed a significant top, but it is still too early to confirm this possibility. We need to see the index's price drop below at least last Wednesday’s “FED Interest Rate Day” low, with confirmation below the September 6 low, to tell us a decline like the correction in July is underway. When it does, the EWP will serve us well in foretelling us where we can expect the following significant low to materialize. So, we will watch the warning levels closely as we advance while staying comfortable long since two weeks ago as long as none of them are breached.
Author

Dr. Arnout Ter Schure
Intelligent Investing, LLC
After having worked for over ten years within the field of energy and the environment, Dr.


