Despite today’s news, the Semiconductor Index is still on track for 5,700

Overview
In our previous update from May 20th, we found that for the Semiconductor Index (SOX) based on the Elliott Wave (EW) Principle, “Assuming five orange waves upward from the late-April grey W-ii/b low, the index should now be in the orange W-4, [to ideally $4800+/-100] followed by orange W-5, ideally reaching $5150+/-50, etc.”
Fast-forwarding, the index reached $4647 on May 23rd, peaked at $5303 on Wednesday, and is currently trading at around $5180. See Figure 1 below. Thus, over the last several updates, our preferred EW count has kept us on the right track, and we must continue to apply it until proven otherwise.
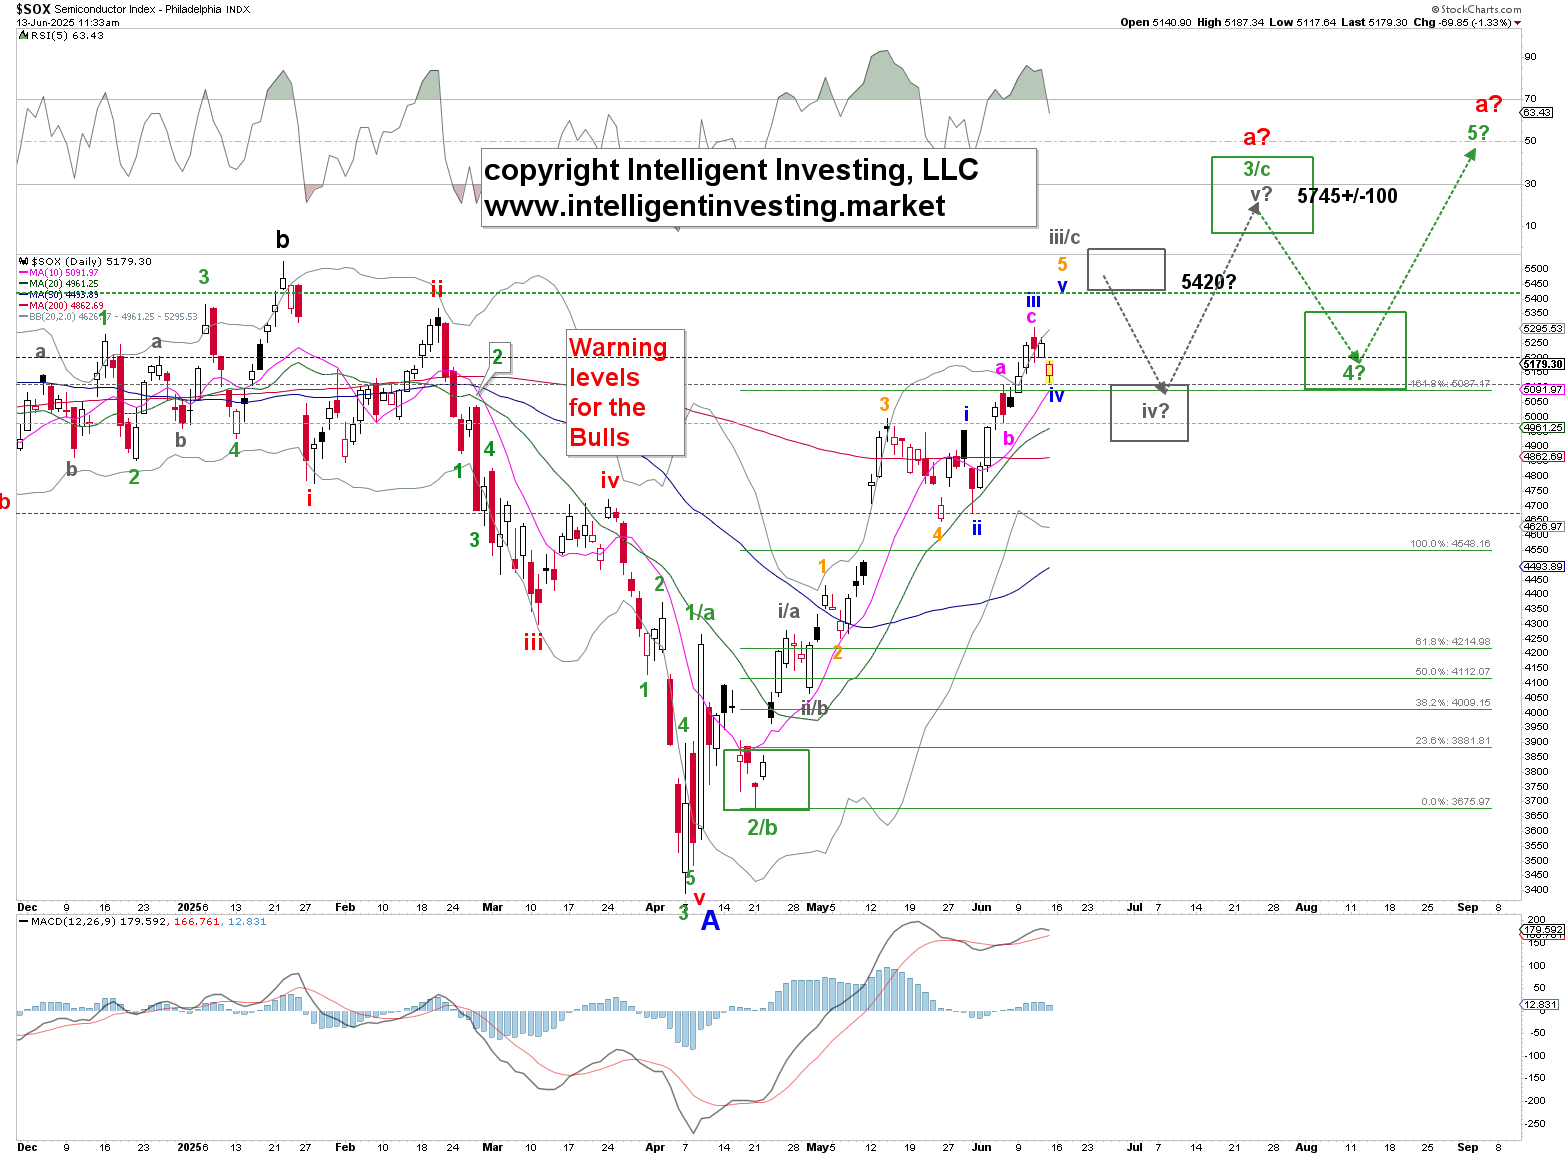
Figure 1. Our preferred short-term EW count with several technical indicators and moving averages.
Although the index surpassed the ideal target of $5150, we aren’t worried about that, as wave extensions can occur but are impossible to predict in advance. Namely, we have our colored warning levels (blue, gray, orange, and red), which indicate whether a move is likely to conclude. These levels rise as prices increase, allowing our premium newsletter members to stay on the right side of the trade for as long as possible. In this case, the index never dropped below the critical levels (orange and red), so we happily continued to stay long.
In the short term, our preferred EW count is for an ending diagonal orange W-5, which consists of five smaller blue waves, forming a “3-3-3-3-3” pattern. In this scenario, on Wednesday, the blue W-iii was completed, and today, the blue W-iv may also have been finished. The ideal target for the blue W-v and all of the grey W-iii/c is approximately $5420. However, due to the 3-3-3-3-3 pattern, we can consider the grey W-iii/c as complete, and the grey W-iv, ideally at $4925 +/- 100, is now in progress. This is our alternative option. See Figure 2 below.
-638854319111674954.png)
Figure 2. Our alternative short-term EW count with several technical indicators and moving averages.
But it requires breaking below at least today’s low, which is right at the gray warning level, to shift focus to this alternative option. Regardless, given that the short-term is more variable and, therefore, less certain than the intermediate- to long-term, we can observe that the SOX needs at least one more push to new highs to complete the rally that began on April 7.
Therefore, we still see pullbacks as opportunities to buy for those trading on shorter timeframes. Meanwhile, since our bullish outlook began in early April, we continue to maintain our long positions accumulated since then.
Author

Dr. Arnout Ter Schure
Intelligent Investing, LLC
After having worked for over ten years within the field of energy and the environment, Dr.


