|

Crude Oil Price News and Forecast: WTI - Downside looks unabated

Elliott Wave View: Oil Downside Target

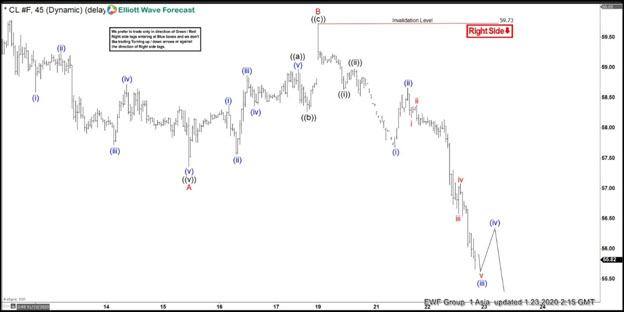
Oil has extended lower and short term Elliott Wave view suggests the decline from 1.8.2020 high is unfolding as a zigzag Elliott Wave structure. Down from January 8 high, wave A ended at 57.36 as a 5 waves impulsive structure. Bounce in wave B ended at 59.73 as a zigzag structure. Up from 57.36, wave ((a)) of B ended at 58.98, wave ((b)) of B ended at 58.27, and wave ((c)) of B ended at 59.73. Read more...

Oil


Crude Oil Futures: Downside looks unabated

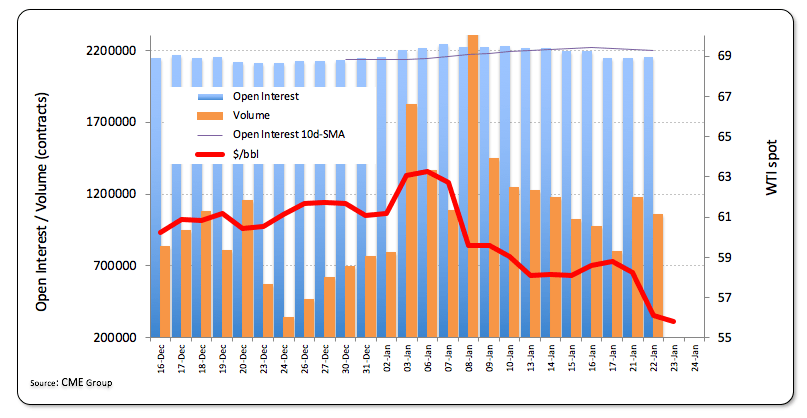
Traders added around 8.3K contracts to their open interest positions on Wednesday, reversing two consecutive pullbacks. Volume, instead, prolonged the choppiness and shrunk by around 115.3K contracts.

Prices of the WTI remain under heavy selling pressure and are already trading in fresh 2020 lows in sub-$56.00 levels, some $10/bbl lower than early January tops. Wednesday’s drop was on the back of rising open interest, leaving the bearish view intact for the time being and allowing for extra losses to, initially, late November low at $54.77. Read more...
 

Oil

WTI off seven-week lows, re-takes $56 ahead of EIA data

WTI (oil futures on NYMEX) is seen making minor recovery attempts in the European session and looks to regains the 56 level, having reached the lowest level in seven weeks at $55.59 in early hours.

The prices fall for the fourth consecutive day this Thursday and shed over 1.50%, as the sentiment around the black gold remains dampened by expectations of weakening oil demand, in the wake of rising concerns that the China coronavirus outbreak could hurt the global economic recovery. Read more...

WTI

Overview
Today last price55.85
Today Daily Change-0.23
Today Daily Change %-0.41
Today daily open56.08
 
Trends
Daily SMA2060.04
Daily SMA5059.05
Daily SMA10057.35
Daily SMA20057.64
 
Levels
Previous Daily High58.36
Previous Daily Low56.05
Previous Weekly High59.28
Previous Weekly Low57.38
Previous Monthly High62.38
Previous Monthly Low55.41
Daily Fibonacci 38.2%56.93
Daily Fibonacci 61.8%57.48
Daily Pivot Point S155.3
Daily Pivot Point S254.52
Daily Pivot Point S352.99
Daily Pivot Point R157.61
Daily Pivot Point R259.14
Daily Pivot Point R359.92

Author

More from FXStreet Team
Share:

Editor's Picks

EUR/USD eyes nine-day EMA barrier after rebounding from 1.1600

EUR/USD gains ground after registering modest losses in the previous session, trading around 1.1620 during the Asian hours on Friday. The technical analysis of the daily chart suggests an ongoing bearish bias as the pair remains within the descending channel pattern.

GBP/USD: Pound Sterling ticks up against US Dollar in countdown to US NFP

The Pound Sterling trades marginally higher to near 1.3365 against the US Dollar during the Asian trading session on Friday. The GBP/USD pair edges up as the US Dollar ticks down ahead of the United States Nonfarm Payrolls data for February, which will be published at 13:30 GMT.

Gold awaits US Nonfarm Payrolls for a clear directional impetus

Gold rebounds above $5,100 early Friday after testing the $5,050 level amid global sell-off. The US Dollar pulls back as profit-taking creeps in ahead of US labor data. For February. 21-day SMA holds amid bullish RSI; a daily closing above 61.8% Fibo is critical for Gold buyers.

Top Crypto Gainers: Lombard, Humanity Protocol, OKB rally on US Fed’s tokenized securities clarity, NYSE investment

Lombard, Humanity Protocol, and OKB rally over the last 24 hours, securing the top-gainer spots in the early Asian session. The US Federal Reserve issued clarity on tokenized securities, which expands its utility and reduces regulatory friction with US banks, driving the Real-World Assets tokenization crypto projects. 

The market compass is pointing at a barrel of Oil

The Asian open is arriving with equities leaning the wrong way, and the reason is not complicated. The market’s compass needle has snapped firmly toward crude. In this tape, oil is not just another input price; it is the gravitational center around which every asset class is orbiting.

Ripple tests recovery strength amid steady ETF inflows, growing retail interest

Ripple (XRP) continues to demonstrate notable resilience as the cryptocurrency market navigates the persistent war in the Middle East after the United States (US) and Israel attacked Iran on Saturday.