|

Copper Price Analysis: Accumulation along a 61.8% golden ratio in action

  • Copper advances along a dynamic support into a key hourly resistance. 
  • The daily chart has all the makings for a bulliosh continuation. 

As per the prior analysisCopper Price Analysis: Bulls lurking in daily demand area, bullish extension on the cards, the price of copper has found demand in the daily support and is stacking up for a move higher for the foreseeable future. 

Copper, daily chart prior analysis

It was stated in the prior analysis that '' we could start to see some accumulation start to come in.

''This would be expected to see the price supported in the demand area as illustrated below resulting in a subsequent bid making prospects for an upside continuation''

Copper live market, daily chart

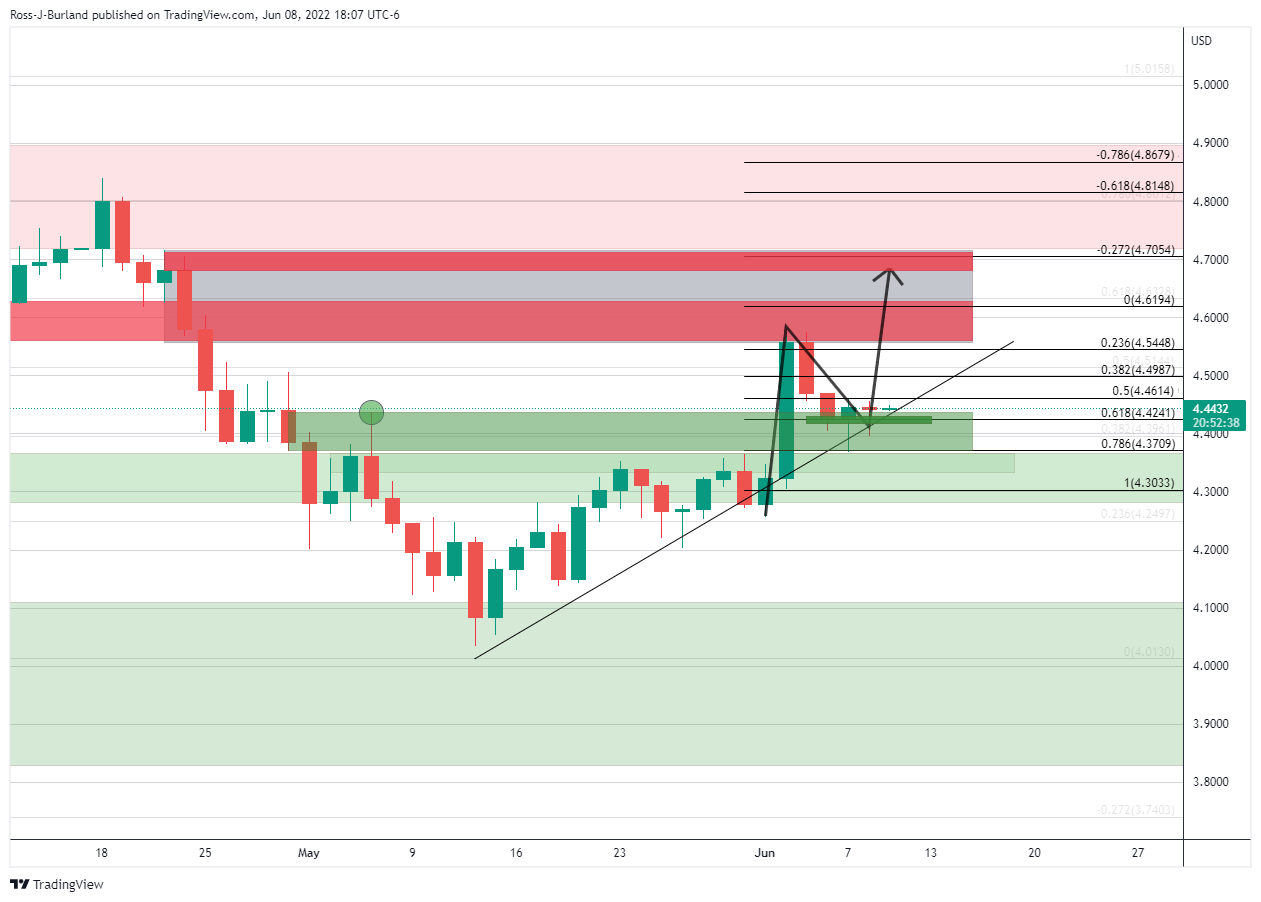
Besides a dip to the 78.6% Fibonacci, the price has been accumulating along the 61.8% ratio and has been respecting the dynamic trendline support so far. 

Copper H1 chart

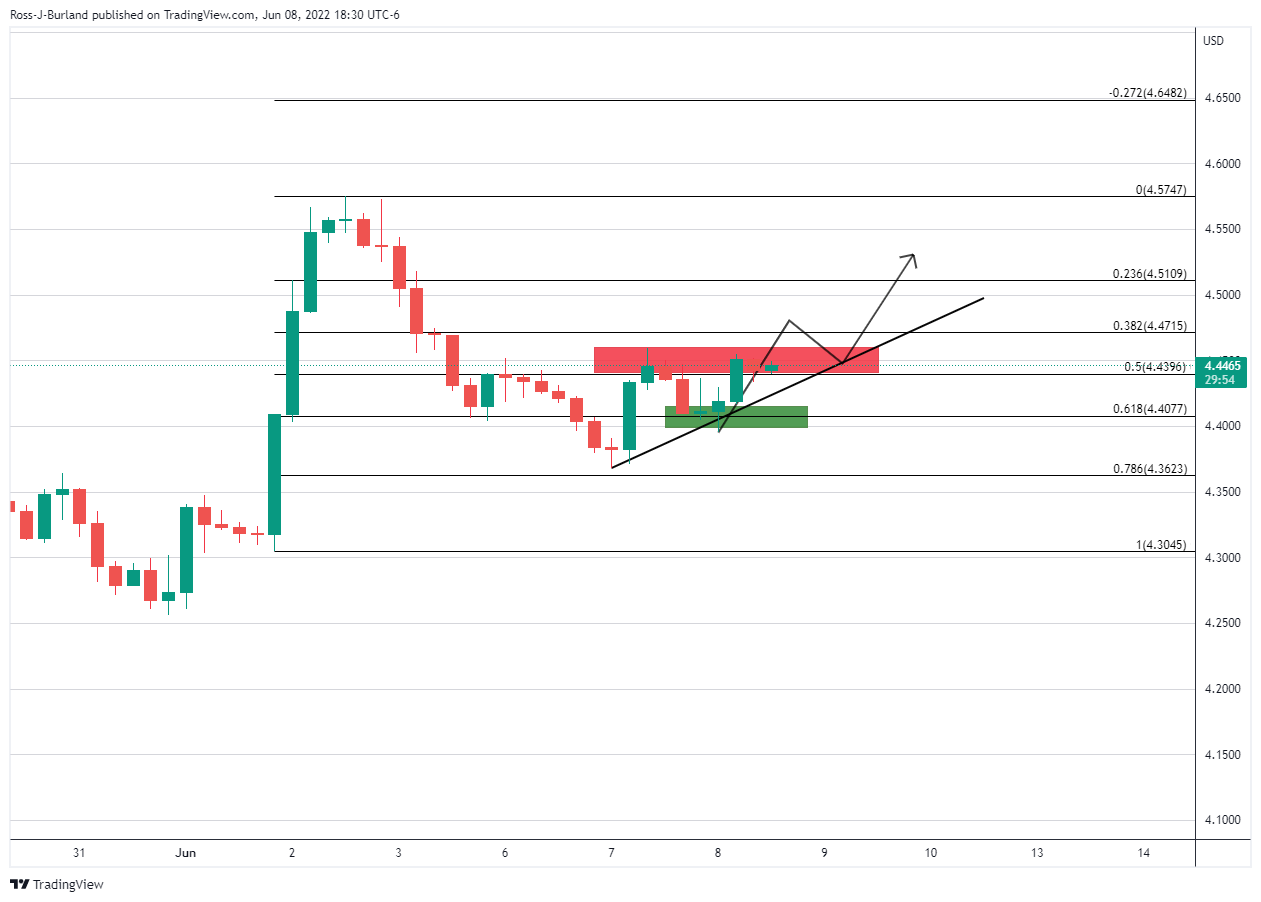
On the hourly chart, the bulls need to get over the line at this point i fthere are going to be near-term prospects of a break higher. 

Author

Ross J Burland

Ross J Burland, born in England, UK, is a sportsman at heart. He played Rugby and Judo for his county, Kent and the South East of England Rugby team.

More from Ross J Burland
Share:

Editor's Picks

GBP/USD appears well offered near 1.3160

GBP/USD builds on Tuesday’s losses, although it now manages to pick up some pace and bounce off earlier multi-month troughs near 1.3140. The Greenback’s solid performance and continued political turmoil in the UK are keeping Cable under persistent pressure, with little sign of a meaningful recovery.

EUR/USD trims losses, hovers around 1.1350

EUR/USD now regains some composure and rebounds to the 1.1350 zone on Wednesday, partially reversing the prior pullback to fresh yearly lows near 1.1320. Meanwhile, spot remains on the back foot as the US Dollar continues to draw support from hawkish Fed expectations and uncertainty over the outcome of US-Iran peace negotiations.

Gold puts $4,000 to the test, new yearly lows

Gold accelerates its decline and gyrates around the key $4,000 mark per troy ounce on Wednesday, its lowest level since November 2025. In the meantime, tighter-for-longer Fed expectations and a broadly firmer US Dollar continue to weigh on the yellow metal, while uncertainty surrounding a potential US-Iran peace agreement has done little to revive demand for the safe haven space.

Crypto Today: Bitcoin, Ethereum, XRP trade under pressure as September Fed rate-hike odds increase

Bitcoin is trading between $62,000 and $63,000 at the time of writing on Wednesday, weighed down by headwinds stemming from macroeconomic uncertainty and geopolitical tensions in the Middle East.

5.90% to 5.45%: Why the Pound ignored the bond market’s relief rally

Keir Starmer resigned on Monday, and the Pound barely moved. That near-silence is the tell. Sterling's real driver these past four months has not been the prime minister, nor the left-leaning frontrunner lining up to replace him, but the long end of the gilt curve, which answers to a force no British politician controls.

Regime change: Inside Kevin Warsh's first move to make the Fed unreadable on purpose

The rate did not move. That was the least interesting thing about Kevin Warsh's first meeting in charge of the Fed. The FOMC held its benchmark at 3.50%-3.75% for the fourth straight meeting, exactly as priced, and then the new chair used his first press conference to dismantle the machinery the market has leaned on for a decade.