China’s trade surplus plummets as exports slow and imports surge

China's March trade surplus slowed to just $51.1bn, a 13-month low, as exports fell more than expected, while imports surged amid rising tech prices. We expect higher energy prices to feed into import prices in the months ahead.
Export growth slumped to a 5-month low
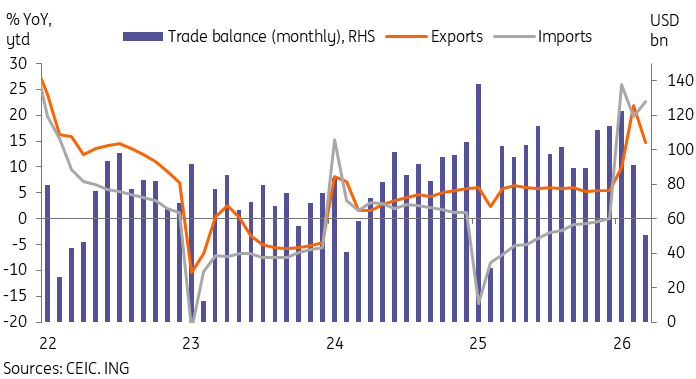
China’s export growth slowed to just 2.5% year-on-year in March, down from 21.8% YoY over the first two months of the year. This came in short of market forecasts, which generally expected high single-digit growth. Overall, for the first quarter, exports are still up an impressive 14.7% YoY thanks to a strong start to the year.
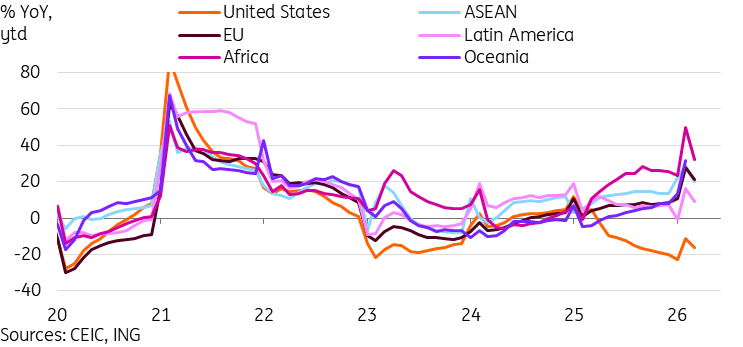
By destination, China's exports to the US remained the most obvious drag. Through 1Q26, exports to the US are down -16.4% YoY, the clear outlier in what otherwise still looks like solid export growth across the board. China's key trading partners in ASEAN (20.5%), the EU (21.1%), Japan (6.9%), and Korea (24.5%) all saw solid export growth at the start of the year. We expect the drag from the US to fade YoY in the coming months, as last April's Liberation Day tariffs led to a notable decline in trade.
By product, China's fastest-growing export categories continued to significantly outperform. In 1Q26, we saw a 77.5% YoY surge in semiconductor exports, a 58.5% rise in auto exports, and 48.7% growth in ship exports. Overall, China's hi-tech exports rose 28.6% YoY, comfortably outperforming the headline. The more price-sensitive export categories, such as toys (-14.8%), footwear (-8.0%), continued to underperform. Rare earth exports, even though restrictions have been loosened, declined -9.0% YoY ytd as well.
So, what do we make of the slowdown in exports? The overall trend is more important than a single month of data, and, net, 1Q26 shows external demand is still holding up well. With the drag from the US expected to ease—assuming no new tariff shocks, which cannot be fully ruled out—external demand should remain an important driver of growth this year.
We expect the drag from exports to the US to lighten in the coming months
Imports surge as China's tech-heavy import mix sees prices climb
Arguably, the bigger surprise was that the slowdown in exports wasn't mirrored in imports, which grew 27.8% YoY in March, up from 19.8% YoY in the first two months of the year.
We attribute this rise to higher-tech product prices, which have led to stunning export growth across the rest of the region, including Taiwan's astonishing 61.8% YoY export growth in the data released last week. For example, we see China's semiconductor imports rose 11.0% YoY ytd by volume, but 45.0% ytd by value. Other categories, such as overall hi-tech imports and automatic data processing machines, don't have a volume breakdown, but show 29.2% YoY ytd and 49.5% ytd growth, respectively, likely reflecting a price component.
The impact of the Iran war and higher oil prices doesn't appear to have fully translated into the data yet. China's crude oil imports are up 8.9% YoY ytd in volume, but down -4.7% ytd in value. Similarly, China's natural gas imports fell -4.0% YoY ytd in volume terms and a steeper -15.4% ytd in value terms. Higher energy prices will likely boost imports further in subsequent months.
Higher imports will help assuage the concerns from China's trading partners, but would also cut the contribution of net exports to China's growth.
Import acceleration and export slowdown result in sharp drop in trade surplus
Trade surplus drop could cut into 1Q26 growth
Thanks to continued strength in imports and a slowdown in exports in March, China's trade surplus fell to a 13-month low of $51.1bn. This is not only well below market expectations but also brings the 1Q26 trade surplus to just $264.3bn. In USD terms, this is down -2.5% YoY from 1Q25. In RMB terms, more relevant for the GDP considerations, this is an even steeper decline of -4.8% YoY.
External demand contributed 1.6pp of China's 5pp growth last year. At the very least, the smaller trade surplus suggests that this contribution will drop off in the 1Q26 data. Combined with higher inflation likely leading to a less favourable GDP deflator, could we be in for a bigger-than-expected slowdown when China's GDP data comes out on Thursday? Markets are looking for 4.8% YoY, and our slightly more conservative 4.7% forecast looks at risk as well after the soft March trade data. We'll likely need to see a rebound in domestic indicators in March to keep growth on track, and if growth falls short, we're likely to hear more calls for ramping up stimulus again.
Author

ING Global Economics Team
ING Economic and Financial Analysis
From Trump to trade, FX to Brexit, ING’s global economists have it covered. Go to ING.com/THINK to stay a step ahead.

















