|

Nasdaq: Bulls aiming at 28,800 after bearish pullback completed

The Nasdaq (NQ100) is testing the all-time high again, which is a critical decision zone. A bullish breakout could see a fresh round of buying. But a bearish reversal indicates the potential of a pullback.

Daily chart

Chart

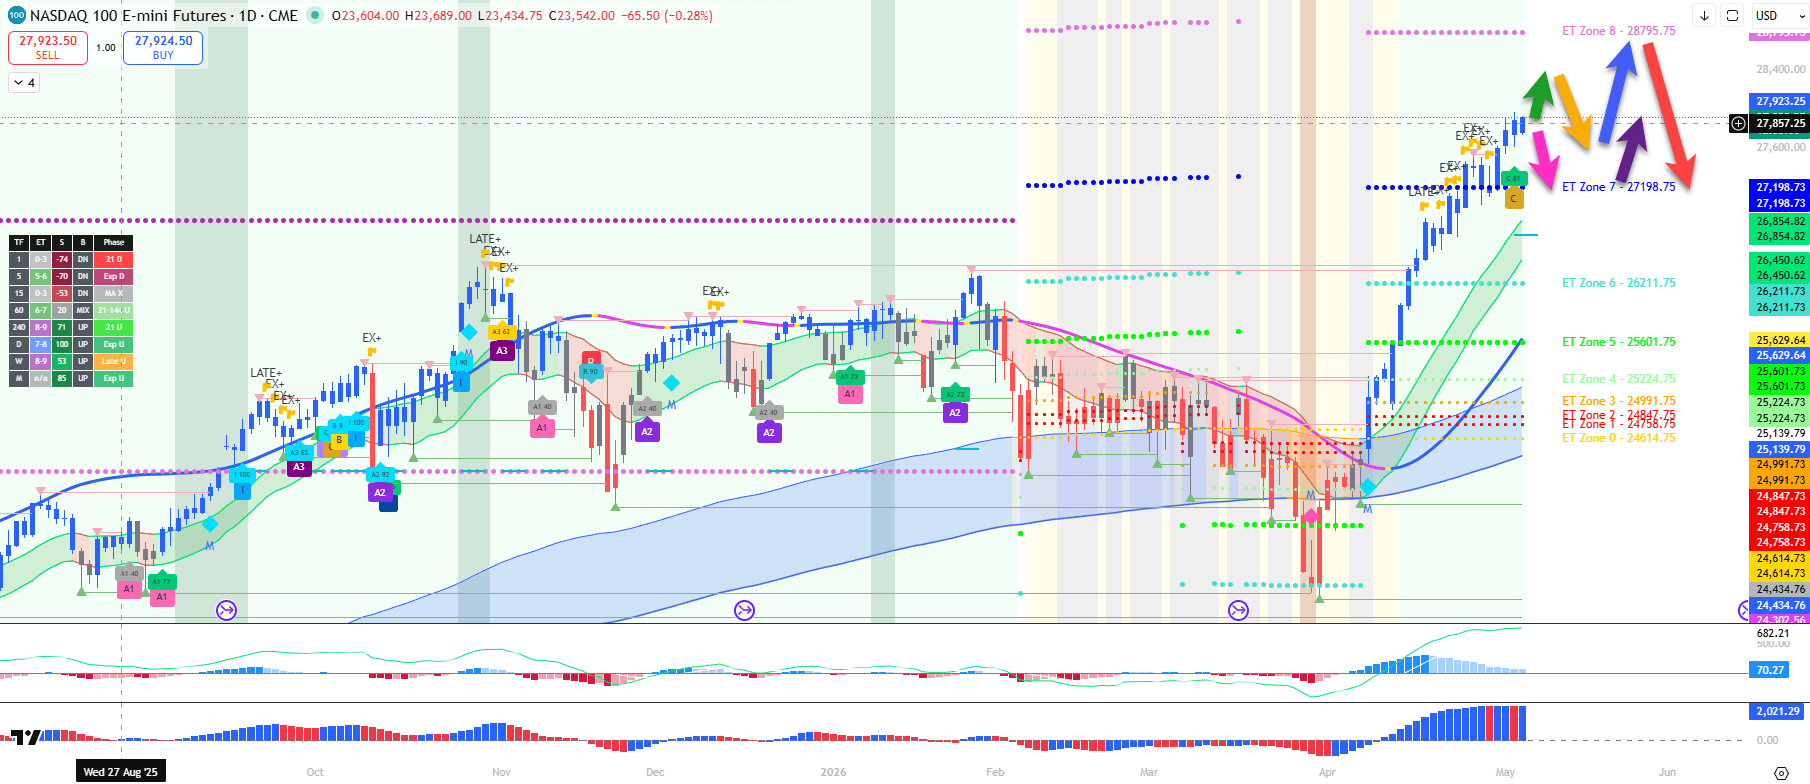
How long can the bullish momentum last?

The bulls have plenty of space until the next key resistance at the ET zone 8. But an immediate continuation is not a given.

Yesterday’s bearish candle is telling a story that the bulls are facing some opposition…

Let’s review the main scenarios:

  • A bearish bounce at yesterday’s high indicates a large retracement lower (pink arrow).
  • Price could fall back to ET zone 7 where a bounce up could occur (purple arrow).
  • A break above the high has potential for one more push higher (green arrow).
  • A new higher high is likely to see a pullback (orange arrow) before hitting ET 8.
  • A larger retracement could finally take place once the uptrend loses its steam. A potential reversal spot could be ET zone 8 (red arrow).

Four-hour chart

Chart

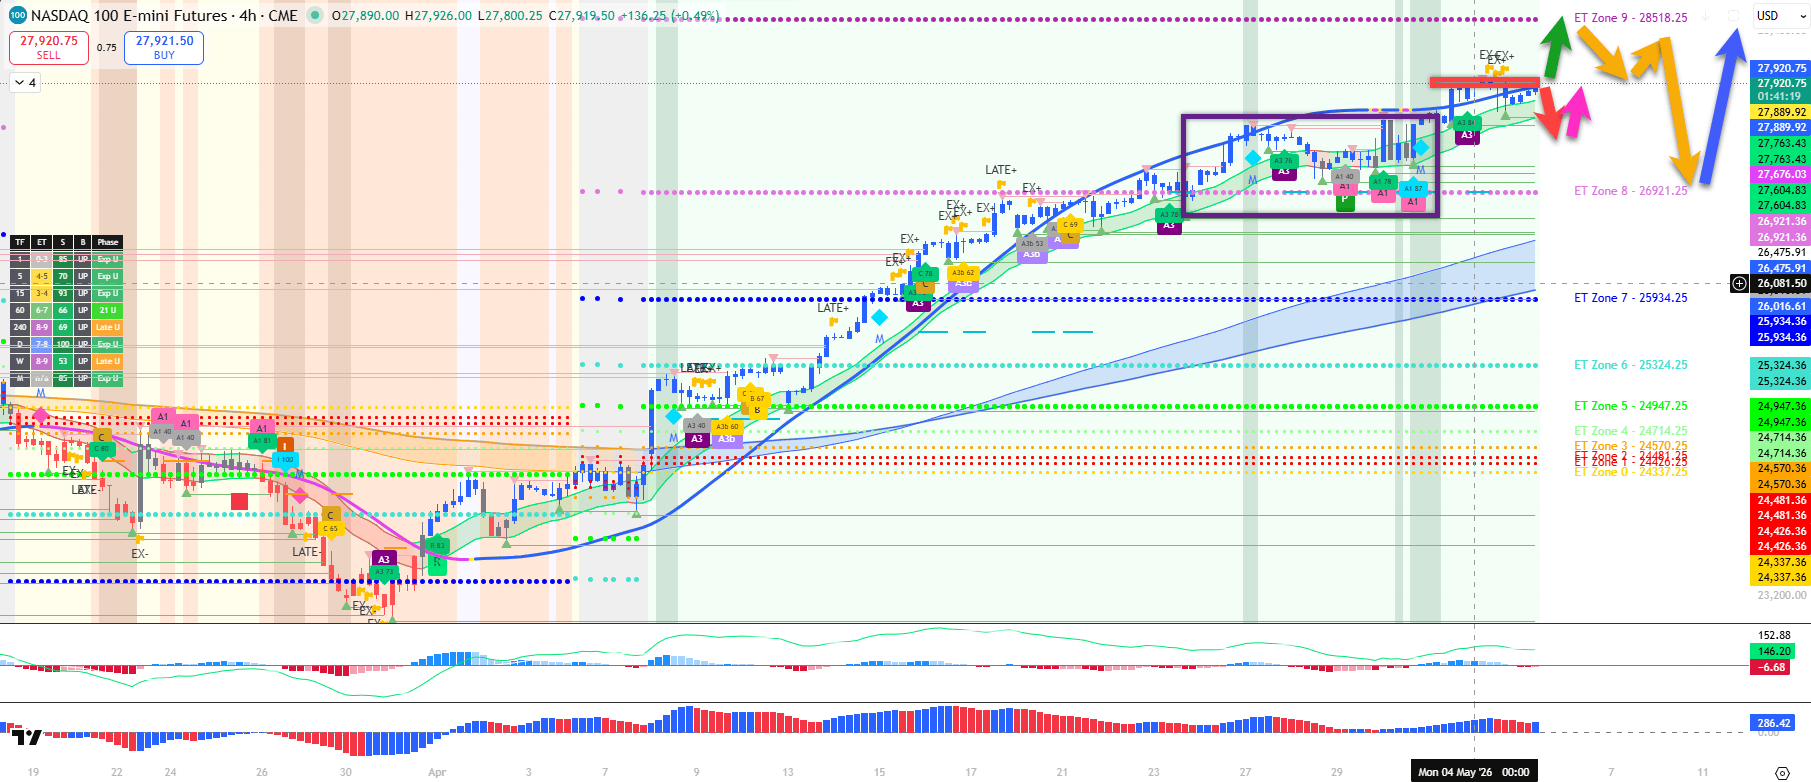
Four-hour trend bounced at ET 8

The 4 hour chart neatly use the ET 8 zone as a support level, after a corrective pattern we warned for on FXstreet (purple box). NQ 100 bearish retracement coming soon. Price is now at the previous top, which is a critical level.    

Let’s analyse the path of least resistance:

  • A bullish breakout above the resistance level (red box) indicates a potential breakout (green arrow) towards the ET zone 9
  • A bearish ABC retracement (orange arrows) is expected to take price back to the 21 ema zone and ET 8 level
  • The uptrend might continue at that support zone (blue arrow)
  • A bearish bounce could see a shallow pullback (red arrows) or deeper retracement first
  • How deep the retracement will decline depends on the momentum of price action and whether price bounces at the bottom of the 21 ema zone (pink arrow) or not.

Author

Chris Svorcik

Chris Svorcik

FS method

Chris Svorcik is a trader, analyst, and educator with over 15 years of experience in financial markets, specializing in moving averages, market structure, and price patterns.

More from Chris Svorcik
Share:

Editor's Picks

GBP/USD bounces off lows, back above 1.3200

After bottoming out near 1.3160, GBP/USD manages to regain a bit of shine and reclaim the 1.3200 mark and beyond at the end of the week. Stronger-than-expected UK Retail Sales data seem to be helping the British Pound limit its losses, while the chaotic UK political environment keeps the bulls at bay for now.

EUR/USD looks consolidative around 1.1460

EUR/USD stages a modest rebound after slipping to a three-month low below 1.1420 at the end of the week. That said, the pair now looks to consolidate humble gains just above 1.1460 despite growing uncertainty surrounding the next round of US-Iran negotiations, which keeps the US Dollar’s downside contained.

Gold slips back to six-day lows, targets $4,100

Gold retreats for the third consecutive day on Friday, eroding gains seen in the first half of the week and approaching the key $4,100 mark per troy ounce. Indeed, the precious metal continues to face headwinds from the Fed's hawkish stance and renewed uncertainty surrounding the next round of US-Iran negotiations.

Breaking: Iran closes the Strait of Hormuz amid ceasefire deal violation
Iran says it is closing the Strait of Hormuz after accusing the United States (US) and Israel of violating the ceasefire. According to Iran, the decision came over the continued Israeli strikes in Lebanon. The Iranian Revolutionary Guard Corps Navy issued a warning to all vessels: "Do not approach the Strait of Hormuz; otherwise, your security will be jeopardized."
The Iran war didn't break the US economy, but what happens next?

Nearly four months after the start of the Iran war, the US economy remains remarkably resilient. While the conflict initially triggered a severe disruption to global energy markets and a sharp rise in Oil prices, recent diplomatic progress between Washington and Tehran has eased concerns about a prolonged supply shock.

Regime change: Inside Kevin Warsh's first move to make the Fed unreadable on purpose

The rate did not move. That was the least interesting thing about Kevin Warsh's first meeting in charge of the Fed. The FOMC held its benchmark at 3.50%-3.75% for the fourth straight meeting, exactly as priced, and then the new chair used his first press conference to dismantle the machinery the market has leaned on for a decade.