|

NQ 100 bearish retracement coming soon

The Nasdaq (NQ100) has made a huge move upwards – as we mentioned last week in our article “NQ Bulls Checkmating Bears in Strong Impulsive Uptrend. Now that price action has made a higher high, we see strong signals that a bearish retracement is highly probable.

Daily chart

Chart

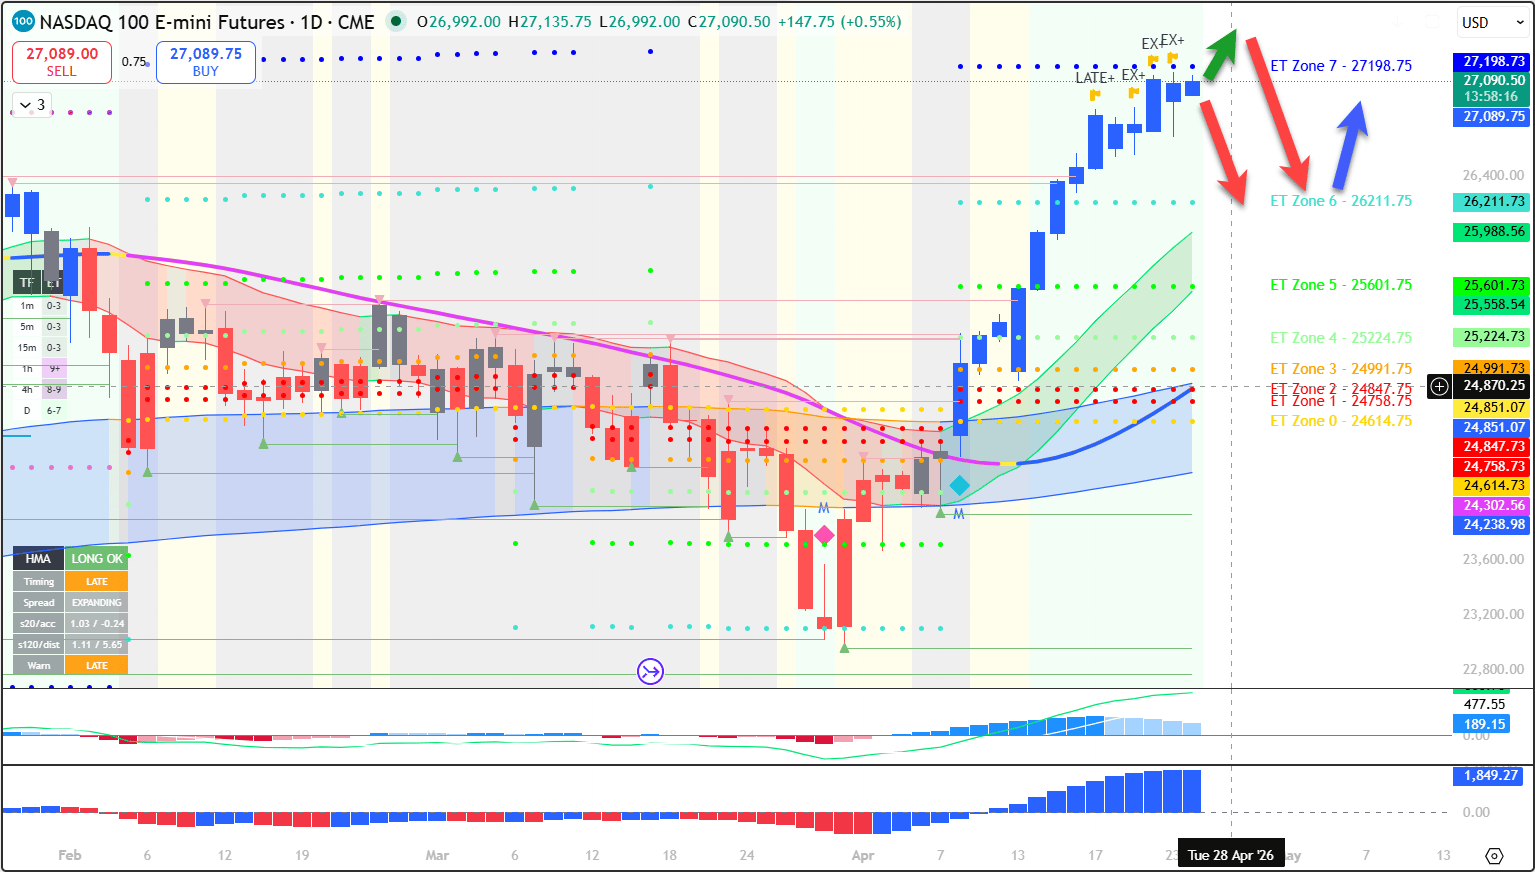
Uptrend running out of steam

The bullish price swing was extremely impulsive (blue diamond) along with dominant bullish candles. However, price action is showing signs of exhaustion at a key resistance level as the HMA pace and angle are slowing down. Let’s review the main factors:

  • The yellow EX signs on top of the candlesticks indicate our alert indicator for exhaustion.
  • Price action has reached a key ET zone 7, which is a key distance from the 144 ema close.
  • A retracement back to the 21 ema zone is likely sooner or later as the current angle of the trend is not sustainable in the long run.

Four-hour chart

Chart

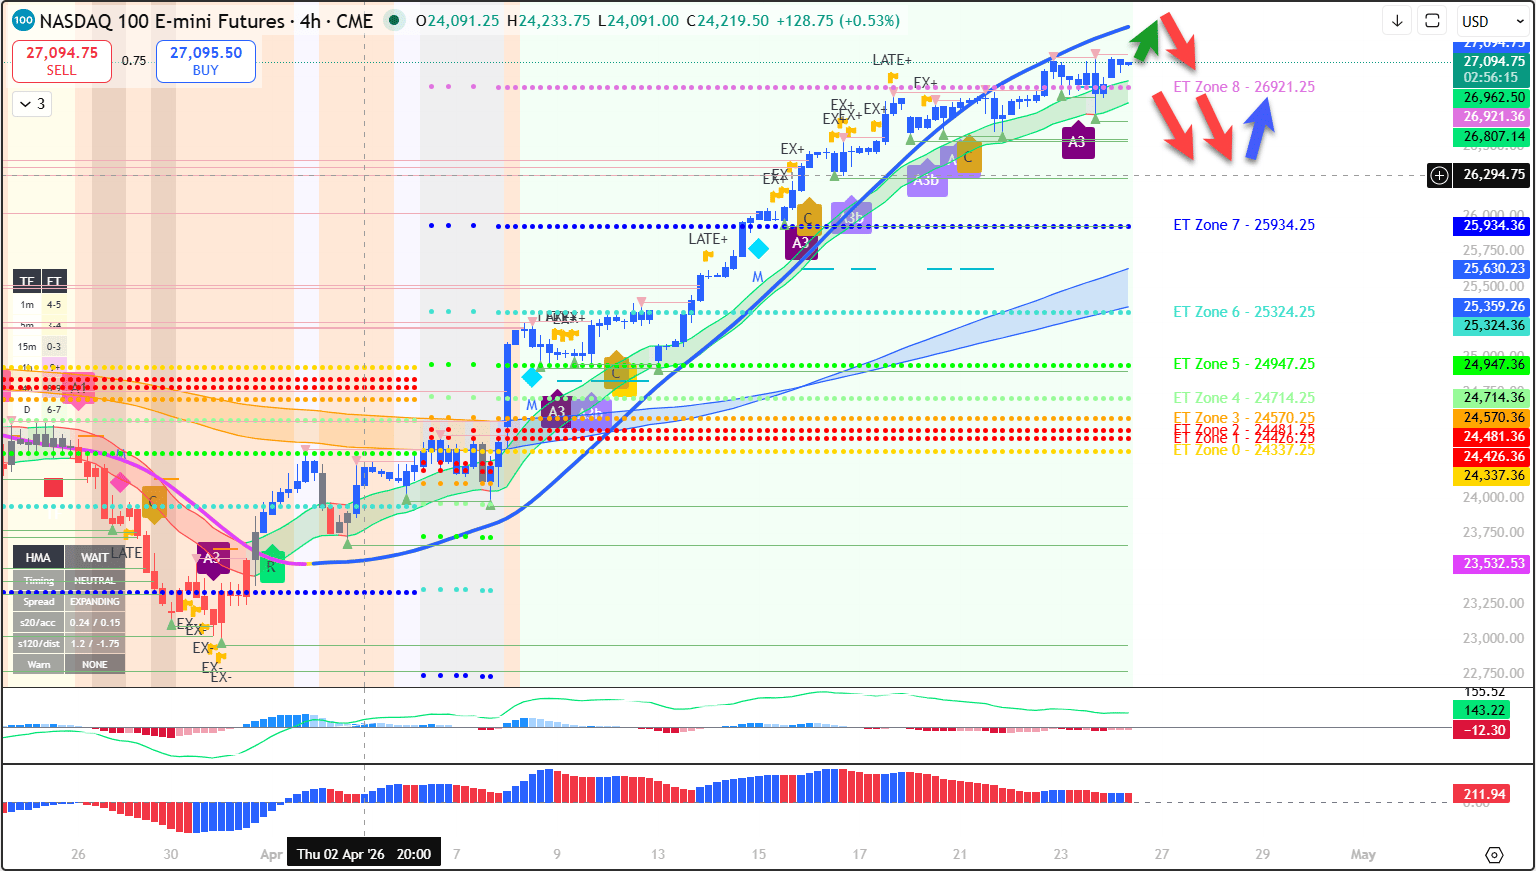
Four-hour trend at critical ET zone 8

The four-hour chart has been in uptrend since the start of April. Especially after April 9, the uptrend started to pick up extra momentum according to our chart background (green colour).

Our roadmap radar explained – here is what price action is expected to do in our view:

  • Price action could still push higher for a new higher first (green arrow).
  • But ultimately sooner or later, a bearish retracement is becoming more and more likely (red arrows).
  • Eventually price action will find support (blue arrow)
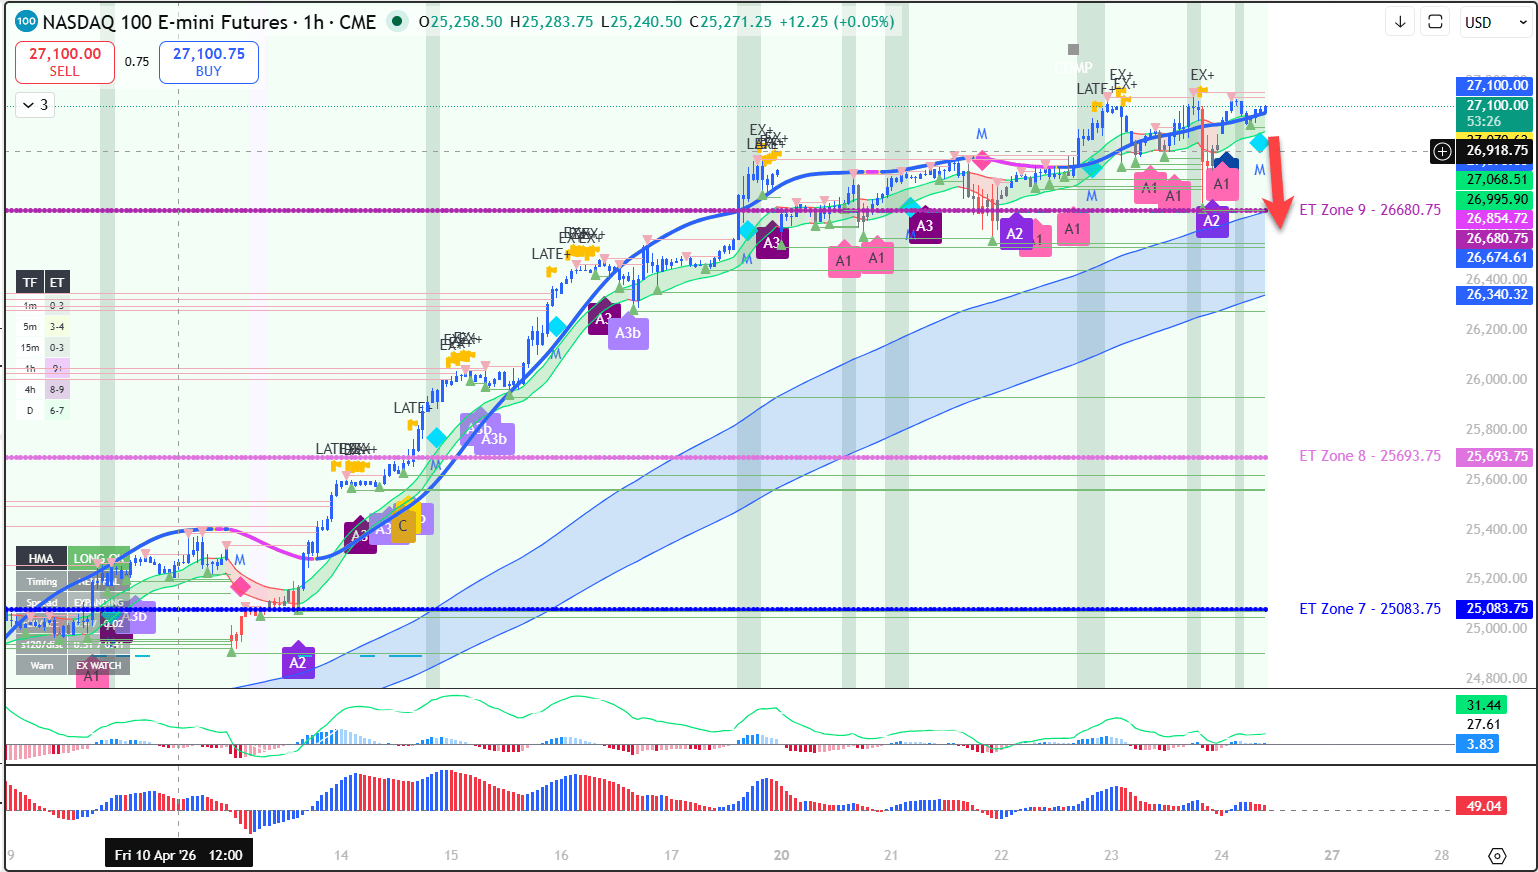
  • On the 1 hour chart, price action has been extremely long above the 21 ema zone.
  • Price has even extended above ET zone 9 – which is showing how far price action has moved away from the 144 ema zone.
  • A breakout below the 21 ema zone (green band) could finally start the bearish pullback towards the 144 ema (red arrow).

One-hour chart

Chart

Author

Chris Svorcik

Chris Svorcik

FS method

Chris Svorcik is a trader, analyst, and educator with over 15 years of experience in financial markets, specializing in moving averages, market structure, and price patterns.

More from Chris Svorcik
Share:

Editor's Picks

EUR/USD climbs above 1.1600 on US–Iran peace breakthrough

The EUR/USD pair stays firm above 1.1600 in the European session on Monday. The US and Iran have reached a deal to reopen the Strait of Hormuz on Sunday, which underpins risk sentiment, supporting the Euro against the US Dollar. Now, the main focus this week remains on the Fed policy decision due on Wednesday.

GBP/USD: US-Iran reaches deal supporting advance beyond 20-day EMA

The GBP/USD pair trades 0.35% higher to near 1.3460 during the late Asian trading session. The Cable extends its week-long advance as market sentiment improves further, following the announcement that the United States and Iran have reached a deal.

Gold gains momentum as US, Iran announce a peace deal

Gold price rises to a weekly high during the early European trading hours on Monday. The precious metal rebounds after the United States and Iran had reached a deal to end their conflict, easing concerns about inflation and higher interest rates.


Bitcoin consolidates gains, Ethereum defends support, XRP nears breakout trigger


Bitcoin, Ethereum and Ripple begin the week on a constructive note as the top three cryptocurrencies attempt to extend rebounds after recovering nearly 4%, 2% and 2.6%, respectively. BTC steadies around $65,600, ETH continues to hold firmly above the key $1,700 support, while XRP nears the upper boundary of the falling channel pattern. 

President Trump announced that the deal with Iran is complete
President Trump announced that the deal with Iran is complete and he authorises the toll-free opening of the Strait of Hormuz and removal of the US Naval blockade. While the agreement is made, it is expected to be signed on Friday to take effect. The Forex market looks stable and could react slowly to the positivity around the news as Iran still expresses its mistrust on the US.
4.2% headline, 0.2% core: Why the Fed's next hike may be targeting the wrong problem

May's CPI put headline inflation at 4.2% on the year, up from 3.8% in April and the hottest reading since April 2023, while core prices rose just 0.2% on the month, undershooting the 0.3% consensus and halving April's pace.