Bullish momentum on freeport McMoran (FCX): Are we about to see an historic comeback? [Video]
![Bullish momentum on freeport McMoran (FCX): Are we about to see an historic comeback? [Video]](https://editorial.fxstreet.com/images/Markets/Equities/Industries/CommunicationServices/communication-services-637435389701278979.jpg)
Freeport-McMoRan Inc. (FCX) is an American mining company that engages in mineral exploration and development, mining and milling of copper, gold, molybdenum, and silver, as well as smelting and refining of copper concentrates. Its primary asset is the Grasberg mine in Papua, Indonesia, which has the world’s largest copper and gold reserves. The company operates in four divisions and has operations in North America, South America, and Indonesia, with holdings in open-pit copper mines and molybdenum mines. Freeport is also the world’s largest producer of molybdenum. FCX is listed on NYSE and is a component of S&P 500 under Materials.
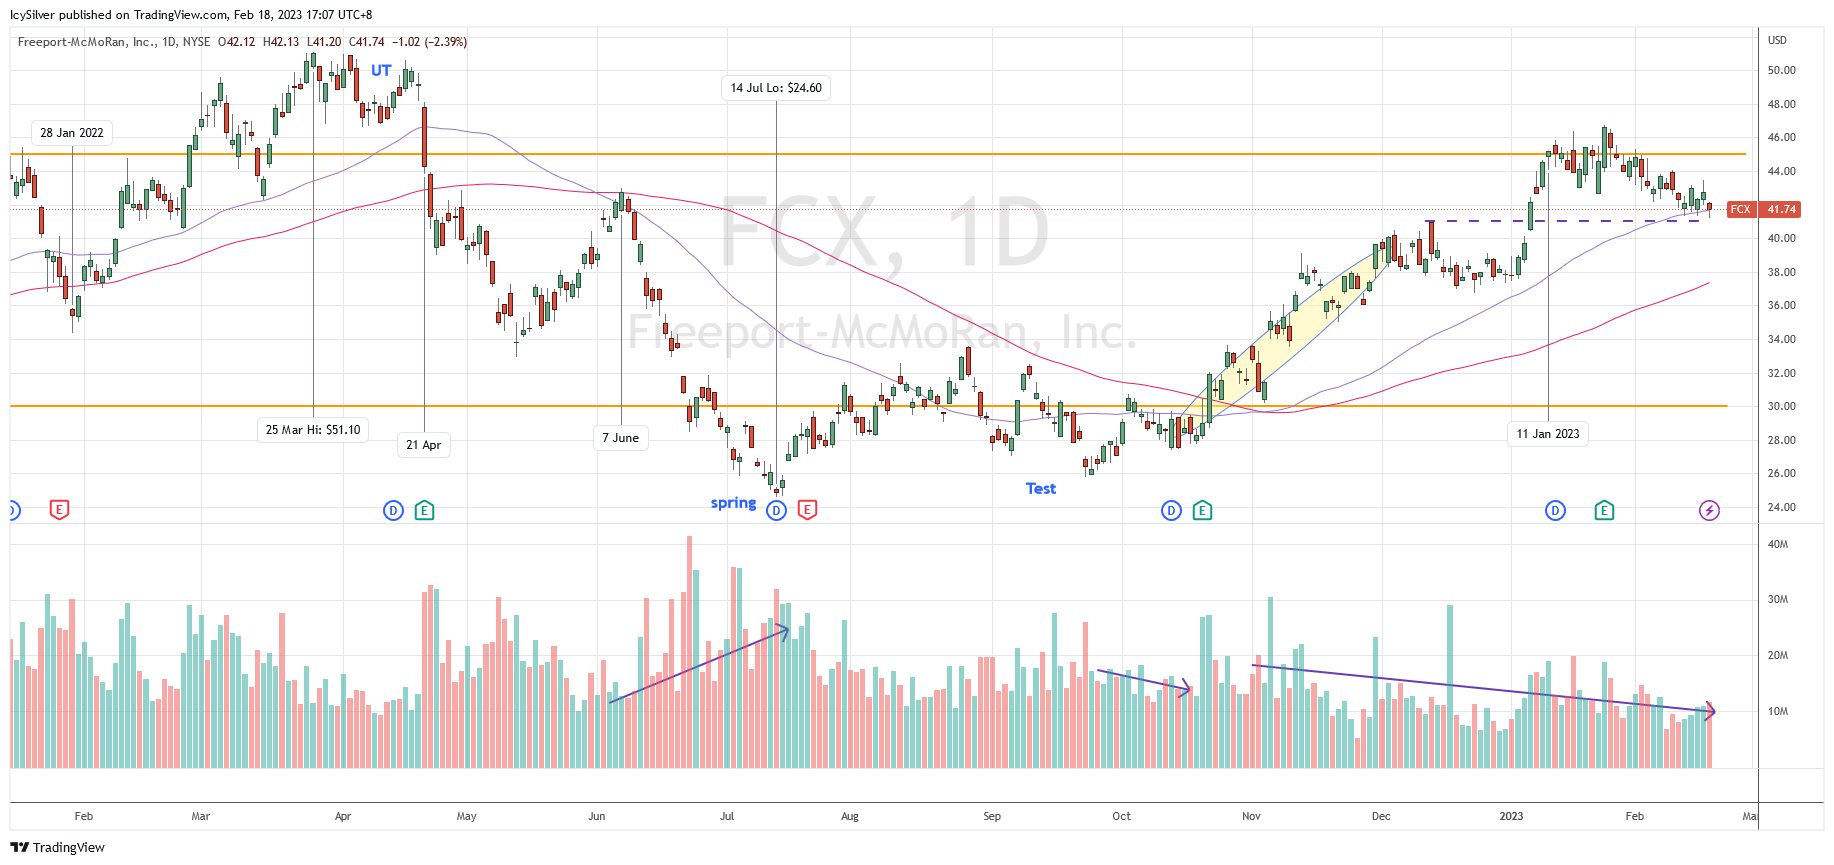
FCX has been bouncing in a large trading range since Feb 2021. It formed a Wyckoff buying climax (BC) on 10 May at around $45, which defined the trading range between $30 and $45.
Around late Jan 2022, the price started a rally to challenge the resistance of $45. It was forming a higher low and even hit $51.10 on 25 Mar. However, the price did not follow through with a bullish momentum and instead broke back into the range, becoming a Wyckoff upthrust (UT). With earning results as catalyst, the bar on 21 Apr denied the bull its glory with a Wyckoff change of character (CHoC) and spike in volume. A wave of Wyckoff sign of weakness (SOW) with increasing volume followed. Although an attempt was made to rally, another SOW took the price down rapidly and broke below the support of $30. This came with increased volume suggesting the presence of more supply.
The climatic run down stopped on 14 Jul at $24.60 with characteristics of a Wyckoff spring. Due to supply on the way down, the price retested the support of $30 several times until a meaningful Wyckoff sign of strength (SOS) rally around 20 Oct.
The price attempted to break $45 on 11 Jan 2023. It continued to test the resistance but had pulled back to support around $41.
Bias
Slightly bullish. According to the Wyckoff method, FCX is attempting to break the $45 resistance. The volume of the pullback since Jan 2023 is on a decreasing trend compared to before July 2022 suggesting exhaustion of supply. If the price can commit to stay above $41, it could attempt another breakout and rally to an all time high of $51.
If the price breaks below $41, it is likely to retest the recent support of $38. Should there be a spike in supply, the price might retest $30 for a prolonged trading range.
FCX was discussed in detail in my weekly live group coaching on 24 Jan 2023 before the market opened. The improving market breadth together with many bullish trade entry setups could suggest a new bull run as discussed in the video below.
Author

Ming Jong Tey
Independent Analyst
Ming Jong Tey has been trading since 2008. He started his learning journey from technical analysis (indicators, Fibonacci, etc...) to value investing. Throughout his journey, he develops an interest in price action with chart pattern trading.


