|

Bull market prediction: How to determine the next bull market with Wyckoff method [Video]

Here is where the stock market could be heading according to the Wyckoff method together with the price target projection using Point and Figure chart.

Watch the video below and pay attention to how to anticipate and confirm both the bullish and the volatile movement by identifying Wyckoff accumulation pattern for traditional and unorthodox Wyckoff schematic.

The bullish setup vs. the bearish setup is 274 to 166 from the screenshot of my stock screener below. Despite the pullback on last Friday, there are still plenty of outperforming stocks ready for entry setup.

Wyckoff method stock screener

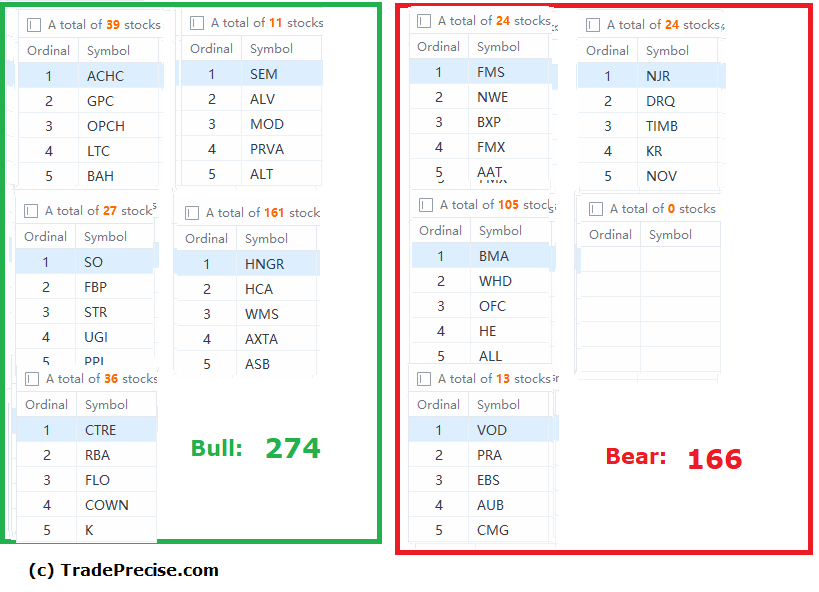
Do bear in mind that although the short-term direction is to the upside, this is still a bear market rally. Volatility on both sides are expected. Right risk management is necessary when trading the top market leaders.Visit TradePrecise.com to get more stock market insights in email for free.

Author

Ming Jong Tey

Ming Jong Tey

Independent Analyst

Ming Jong Tey has been trading since 2008. He started his learning journey from technical analysis (indicators, Fibonacci, etc...) to value investing. Throughout his journey, he develops an interest in price action with chart pattern trading.

More from Ming Jong Tey
Share:

Markets move fast. We move first.

Orange Juice Newsletter brings you expert driven insights - not headlines. Every day on your inbox.

By subscribing you agree to our Terms and conditions.

Editor's Picks

EUR/USD clings to small gains near 1.1750

Following a short-lasting correction in the early European session, EUR/USD regains its traction and clings to moderate gains at around 1.1750 on Monday. Nevertheless, the pair's volatility remains low, with investors awaiting this weeks key data releases from the US and the ECB policy announcements.

GBP/USD remains confined in a range above mid-1.3300s ahead of UK jobs report

The GBP/USD pair extends its sideways consolidative price move through the Asian session on Tuesday and currently trades around the 1.3370-1.3365 region, nearly unchanged for the day. Traders seem reluctant and opt to wait for this week's important macro releases and the key central bank event risk before placing fresh directional bets.

Gold defends $4,300 as focus shifts to US NFP, PMI data

Gold price holds the $4,300 level, easing from the highest since October 21 in the Asian trading hours on Tuesday. The precious metal stays afloat on further US Federal Reserve rate cut bets. The US Nonfarm Payrolls report will take center stage later on Tuesday. Also, the US Retail Sales and Purchasing Managers Index will be published. 

Top Crypto Losers: Aster, Midnight, and Ethena extend losses as selling pressure mounts

Aster, Midnight, and Ethena are the altcoins with the most losses over the last 24 hours, as the broader cryptocurrency market weakens amid Bitcoin dropping below $86,000.

NFP preview: Complex data release will determine if Fed was right to cut rates

The long wait is over, and the Bureau of Labor Statistics in the US will release nonfarm payrolls reports for both November and October at 1330 GMT on Tuesday. The overall NFP figure for October is expected to be -10k, however, it is expected to be influenced by a massive 130k drop in federal department workers. 

BNB Price Forecast: BNB slips below $855 as bearish on-chain signals and momentum indicators turn negative

BNB, formerly known as Binance Coin, continues to trade down around $855 at the time of writing on Tuesday, after a slight decline the previous day. Bearish sentiment further strengthens as BNB’s on-chain and derivatives data show rising retail activity.