Bovespa Index Elliott Wave technical analysis [Video]
![Bovespa Index Elliott Wave technical analysis [Video]](https://editorial.fxsstatic.com/images/i/charts-02_XtraLarge.jpg)
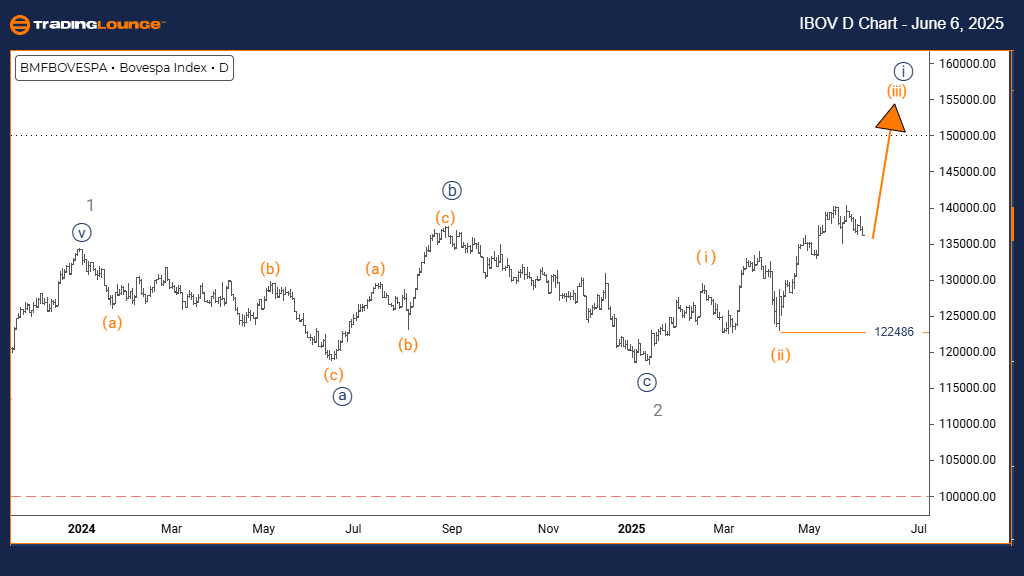
Bovespa Index Elliott Wave technical analysis
Function: Bullish Trend.
Mode: Impulsive.
Structure: Orange Wave 3.
Position: Navy Blue Wave 1.
Direction next lower degrees: Orange Wave 4.
Details: Orange wave 2 appears complete; orange wave 3 is now active.
Wave cancel invalidation level: 122486.
The daily analysis shows strong bullish movement in the Bovespa Index, continuing within a structured uptrend. Currently, orange wave 3 is progressing, following the conclusion of orange wave 2’s correction. This phase, within navy blue wave 1, suggests the index has entered a typically forceful part of an Elliott impulsive sequence.
The impulsive behavior indicates robust buying interest. With wave 3 underway, significant upside potential remains unless the index breaks the critical invalidation level of 122486, which would negate the current count and possibly suggest a more complex correction or a trend shift.
Traders can use this structure to understand the market’s current phase and expect potential for further upward movement. Orange wave 4 is likely the next step once orange wave 3 ends. Market participants should watch for continuation signals, keeping risk controls in place due to the advanced nature of the wave.
Day chart
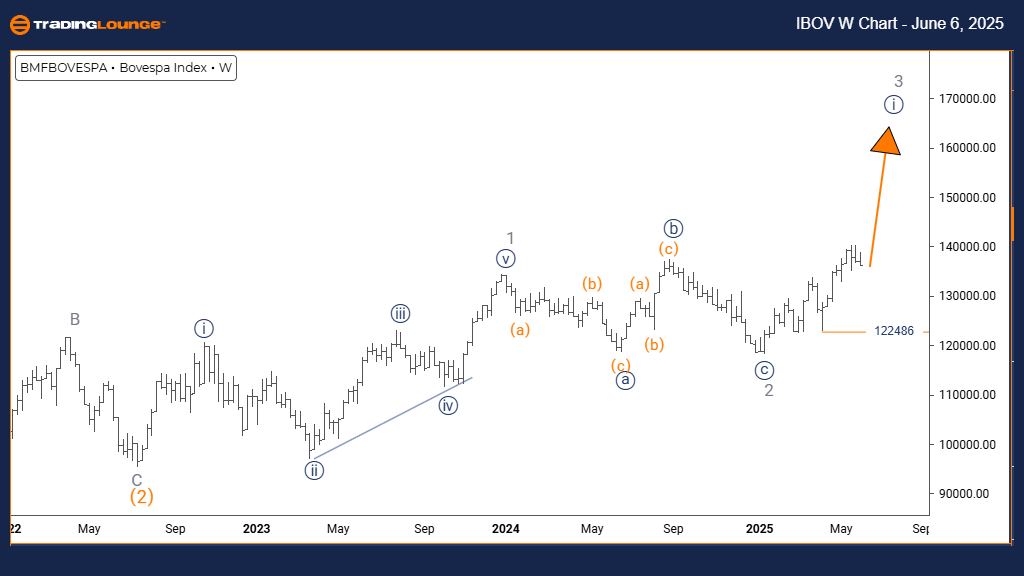
Bovespa Index Elliott Wave technical analysis
Function: Bullish Trend.
Mode: Impulsive.
Structure: Navy Blue Wave 1.
Position: Gray Wave 3.
Direction next lower degrees: Navy Blue Wave 2.
Detalis: Gray wave 2 appears complete; navy blue wave 1 is now underway.
Wave cancel invalidation level: 122486.
The weekly chart suggests a strong bullish phase for the Bovespa Index. The structure shows navy blue wave 1 progressing within a larger gray wave 3, reflecting an early but significant leg in an overall upward trend. This marks the beginning of a new impulsive sequence after the conclusion of gray wave 2.
With navy blue wave 1 active, the current movement suggests further upside. Any decline below 122486 would invalidate this count and prompt reevaluation. Otherwise, the setup indicates continuation of the bullish cycle.
This outlook provides confidence in the ongoing trend. Once navy blue wave 1 completes, a minor pullback in navy blue wave 2 is expected. Until then, traders should track the price for strength and maintain discipline, aware of the invalidation threshold.
Weekly chart
Bovespa Index Elliott Wave technical analysis [Video]
Author

Peter Mathers
TradingLounge
Peter Mathers started actively trading in 1982. He began his career at Hoei and Shoin, a Japanese futures trading company.


