BoJ intervention risk nearing as USD/JPY tests 160 again

USD/JPY is back near the level where Japan can no longer stay quiet.
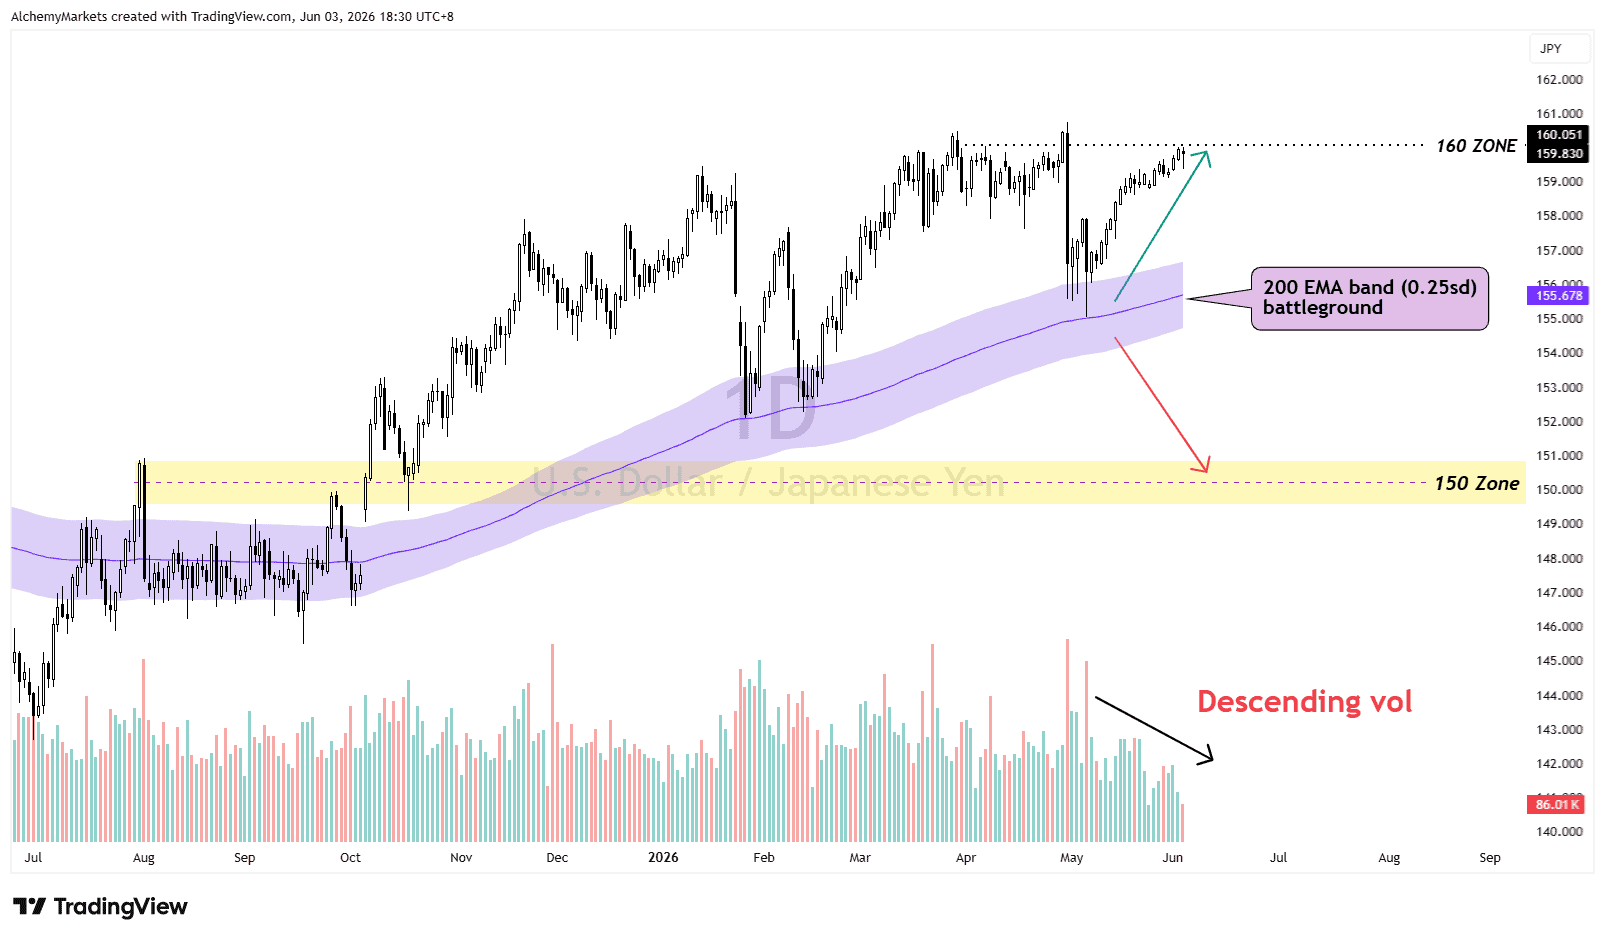
For the past three months, the 160 zone has acted as more than just resistance. It has become the area where traders start pricing intervention risk, official warnings get louder, and yen weakness turns into a policy problem.
The pair came extremely close again yesterday, reaching 159.988 before pulling back slightly.
It’s reported that the yen weakened back toward the same 160 area linked to Japan’s previous intervention, with officials again warning that they are ready to respond to excessive currency moves. Japan previously spent around ¥11.7 trillion, or roughly $73 billion, defending the yen.
USD/JPY is testing Japan’s pain threshold
On the USD/JPY chart, the broader trend is still supported.
Price remains above the 200 EMA band, and buyers have continued to defend pullbacks since the May rebound. However, the latest move into the 160 zone has also come with descending volume, which makes the push look less convincing.
That alone does not confirm a reversal. USD/JPY can still grind higher when the dollar side is supported by yields and Fed pricing.
But near a policy-sensitive level like 160, weaker participation becomes more important.
The key point for traders is not that USD/JPY “must” reverse from 160. It’s that this area contains a higher level of intervention risk.
Should USDJPY bump above 160, it would show that the market is still willing to test Japan’s tolerance.
A rejection from the same zone would put focus back on whether intervention fear, BoJ rate-hike expectations, or profit-taking are starting to matter again.
DXY is still supporting the Dollar side
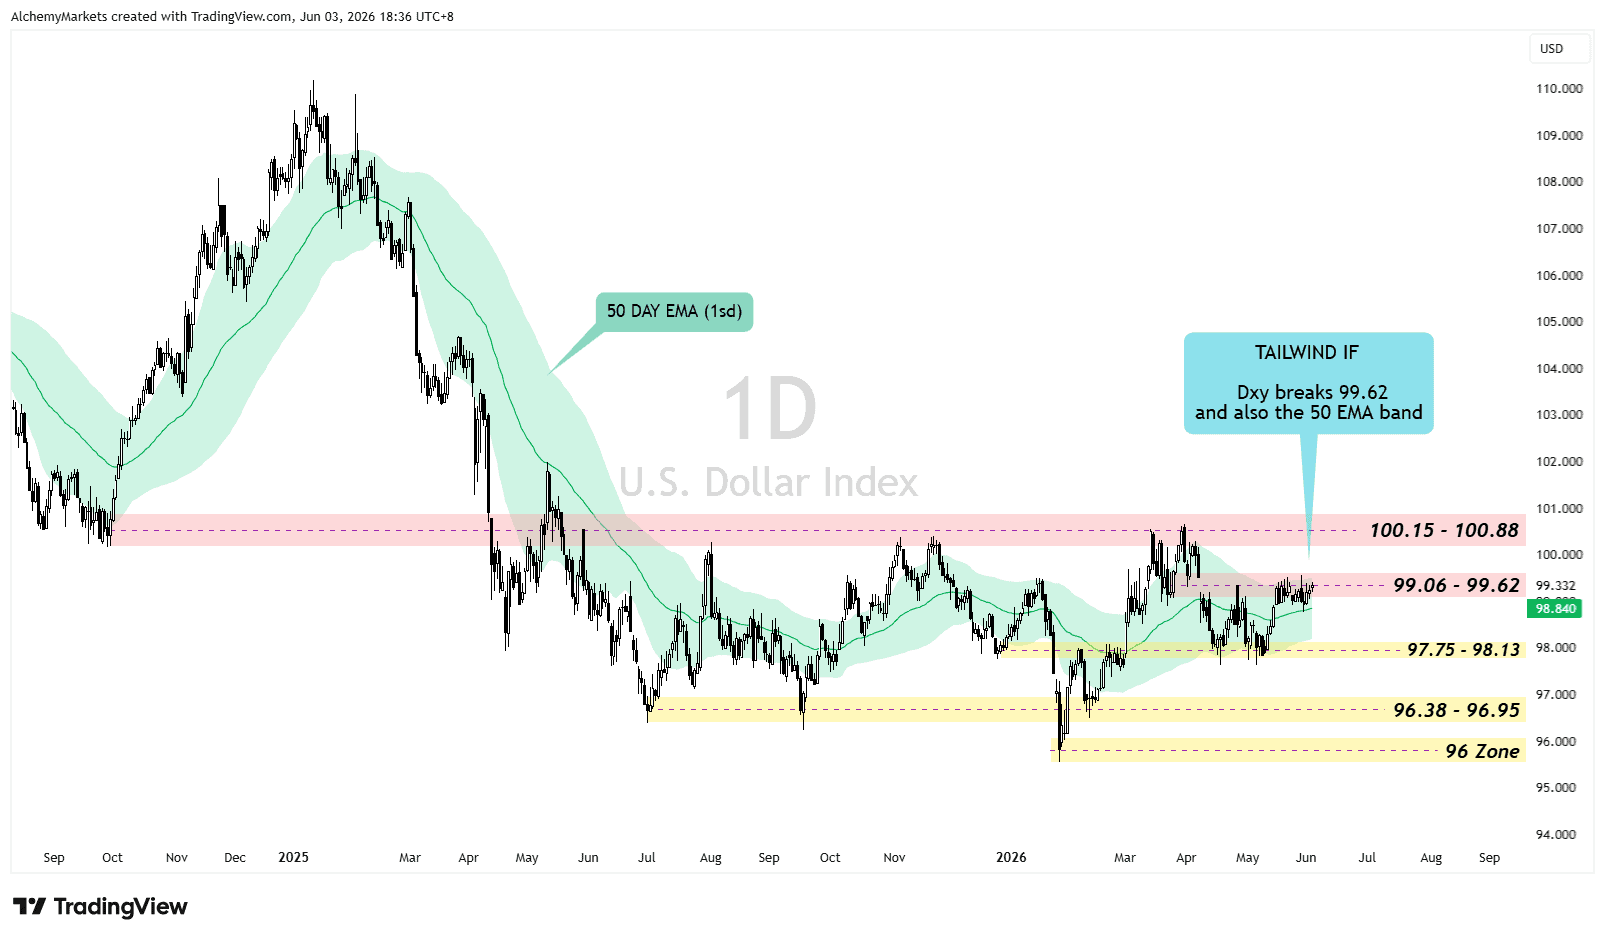
The DXY chart explains why USD/JPY has not rolled over yet.
The dollar index is pressing into the 99.06 to 99.62 resistance area, with the 50-day EMA band sitting nearby. If DXY breaks above that area, USD/JPY gets stronger dollar support into the 160 zone.
This is why the view is mixed.
USD/JPY is not rising purely because the yen is weak. The dollar side is also being supported by hawkish US rate pricing.
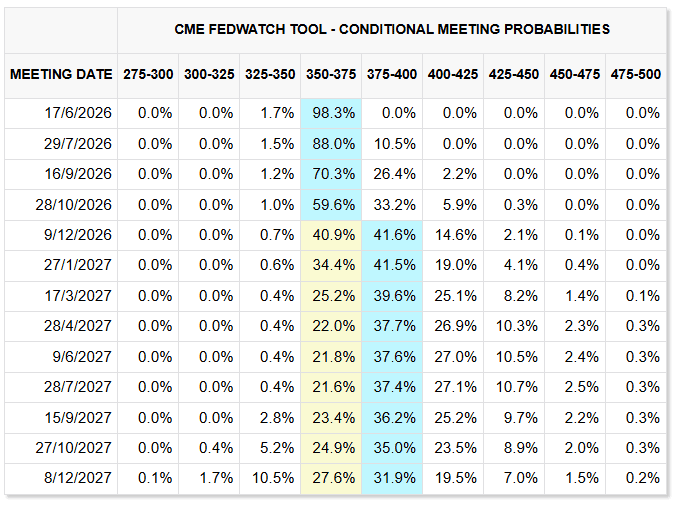
The FedWatch table shows a 98.3% probability that the Fed holds rates at 3.50% to 3.75% on 17 June, while later meetings still lean towards rates staying high rather than moving into a deep cutting cycle.
So even if Japanese officials push back verbally, USD/JPY may struggle to fall properly unless DXY fails resistance, US yields soften, or traders start pricing stronger BoJ action.
US yields are the key confirmation chart
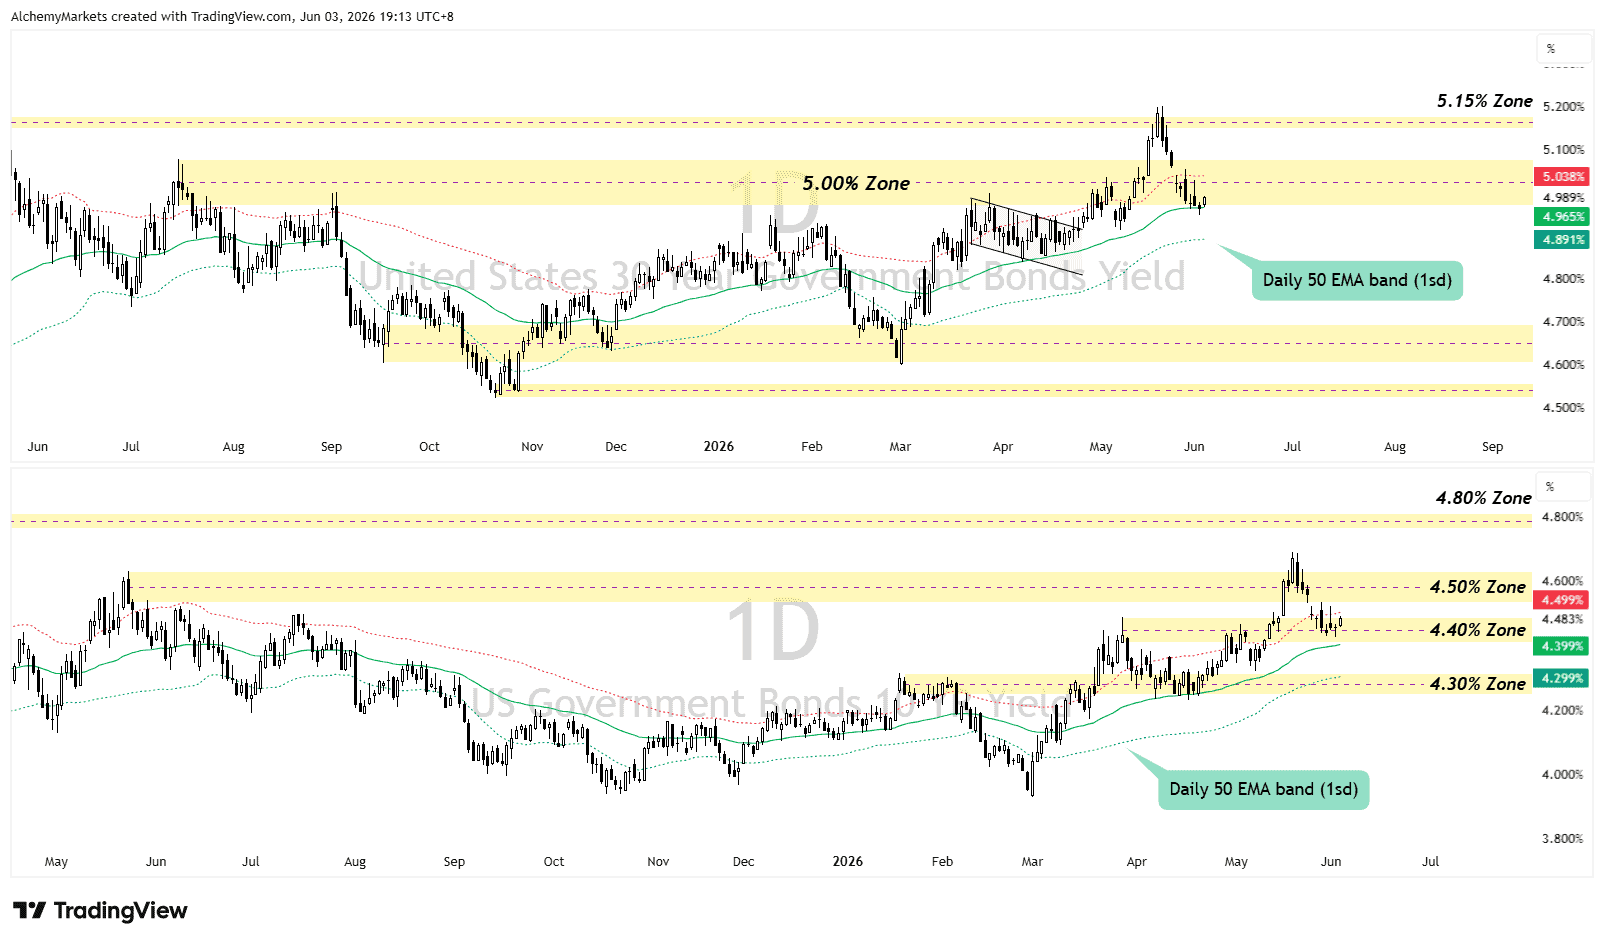
The yield chart is the most useful addition because it explains whether USD/JPY is being supported by the rate market.
The US 10-year yield has pulled back from its recent spike, but it is still holding around the 4.40% to 4.50% zone. The 30-year yield has also cooled from the 5.15% zone, but remains near the 5.00% area.
If US yields stay elevated, the carry trade remains attractive and the dollar keeps support.
The warning would come if USD/JPY starts falling while yields stay firm. That would suggest the move is not being driven by normal rate-market pressure. It would point more toward yen-specific demand, intervention fear, or forced position unwinding.
The BoJ may need to back its warnings
The next major test is the BoJ meeting on June 15 to 16.
BoJ Governor Kazuo Ueda has signalled that the central bank must discuss rate hikes if inflation risks outweigh downside risks. It’s reported that his comments increased speculation of a June hike, especially as higher energy prices make inflation harder to dismiss.
That gives the yen two possible sources of support.
The first is direct intervention from Japan’s Ministry of Finance. The second is a more hawkish BoJ, which would give the yen policy support instead of relying only on currency intervention.
The problem is timing. Intervention can happen suddenly. A BoJ decision is scheduled. That means USD/JPY can remain supported right until traders decide the policy risk is no longer worth ignoring.
What would make intervention risk clearer?
A sharp USD/JPY drop alone is not enough. The cleaner warning comes when yen strength appears across several markets, while DXY and US yields do not fully explain the move.
Warning sign | What it suggests |
USD/JPY drops hard, but DXY barely moves | Yen-specific buying, not broad dollar weakness |
EUR/JPY, GBP/JPY and AUD/JPY fall together | Broad yen strength across crosses |
USD/JPY falls while US yields stay firm | Move is not being led by lower US yields |
USD/JPY falls while treasuries sell off and yields rise | Possible reserve-related pressure, but not proof |
USD/JPY breaks above 160, then quickly falls back below it | Failed tolerance test around Japan’s intervention zone |
The bond point is useful, but it needs careful wording.
If Treasuries dump, prices fall and yields rise. In theory, Japan can fund intervention by selling dollar assets and buying yen. Those dollar assets may include Treasuries, bills, deposits, or other reserves. So if USD/JPY falls sharply while US yields rise, traders may question whether the move is intervention-related.
But it is not proof. Japan does not need to visibly dump long-dated Treasuries every time it intervenes.
Final read
USD/JPY is caught between two opposing forces.
The dollar side still supports the pair. FedWatch pricing shows little appetite for a June cut, US yields remain elevated, and DXY is testing resistance.
But the 160 zone is where that bullish USD/JPY logic becomes politically dangerous.
Japan has already intervened once, officials are warning again, and the BoJ meeting on June 15 to 16 gives traders another reason to be careful around fresh yen weakness.
For now, 160 is the pressure point.
USD/JPY is not just testing resistance. It is testing how much yen weakness Japan is willing to accept.
Author

Zorrays Junaid
Alchemy Markets
Zorrays Junaid has extensive combined experience in the financial markets as a portfolio manager and trading coach. More recently, he is an Analyst with Alchemy Markets, and has contributed to DailyFX and Elliott Wave Forecast in the past.


