Bitcoin Price Forecast: BTC consolidates near $78,000 as ETF inflows surge
- Bitcoin trades around $78,000 on Monday, consolidating after a massive rally in recent weeks lost momentum.
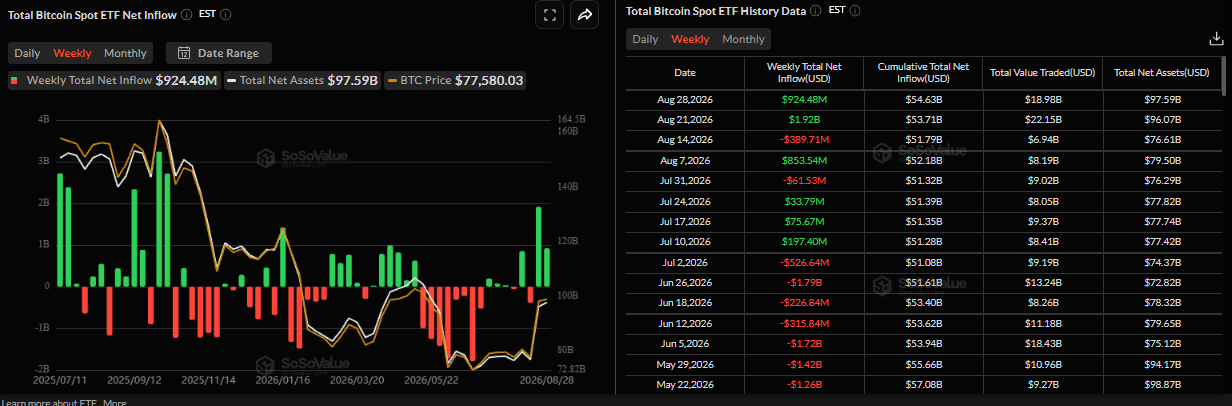
- US-listed spot Bitcoin ETFs record a net inflow of $924.48 million last week, marking the second week of heavy inflows.
- Renewed Middle East tensions lift oil prices, raising inflation risks and potentially limiting the Fed’s room to ease monetary policy, which could cap BTC.

Bitcoin (BTC) trades near $78,000 on Monday, consolidating after its recent rally as strong institutional demand continues to provide support. However, escalating Middle East tensions, rising oil prices and growing inflation concerns dampened risk appetite, which could cap the Crypto King’s upside.
Institutional demand remains robust
Institutional demand for Bitcoin remained strong last week. SoSoValue data showed spot ETFs recorded a net weekly inflow of $924.48 million on Friday, marking the second week of heavy inflows. If these inflows continue and intensify, BTC could support gains ahead.
Geopolitical tensions, rising oil prices weigh on BTC
Despite strengthening institutional demand for BTC, traders should be cautious, as the latest developments in the Middle East crisis are capping risk sentiment.
On Sunday, US forces struck two Iranian launchers on Larak Island. Iran retaliated by launching ballistic missiles from Tehran, Lorestan, Karaj, Khorramabad and Shiraz, and anti-ship cruise missiles from southern Iran toward the Strait of Hormuz.
Moreover, US Treasury Secretary Scott Bessent said that new secondary sanctions were likely to be unveiled weekly in the effort to pressure Iran.
These developments are heightening uncertainty surrounding the Strait of Hormuz, keeping the war-risk premium elevated, supporting the US Dollar (USD), dampening risk appetite and weighing on BTC.
Adding to the pressure, Federal Reserve (Fed) Chair Kevin Warsh, speaking at the central bank’s annual symposium in Jackson Hole last Friday, indicated that interest rates could need to move higher if further progress is not made in containing inflation. Rising energy prices could further complicate the inflation outlook, with West Texas Intermediate (WTI) crude oil opening higher on Monday and gaining more than 3.47% to trade around $85.50 per barrel at the time of writing.
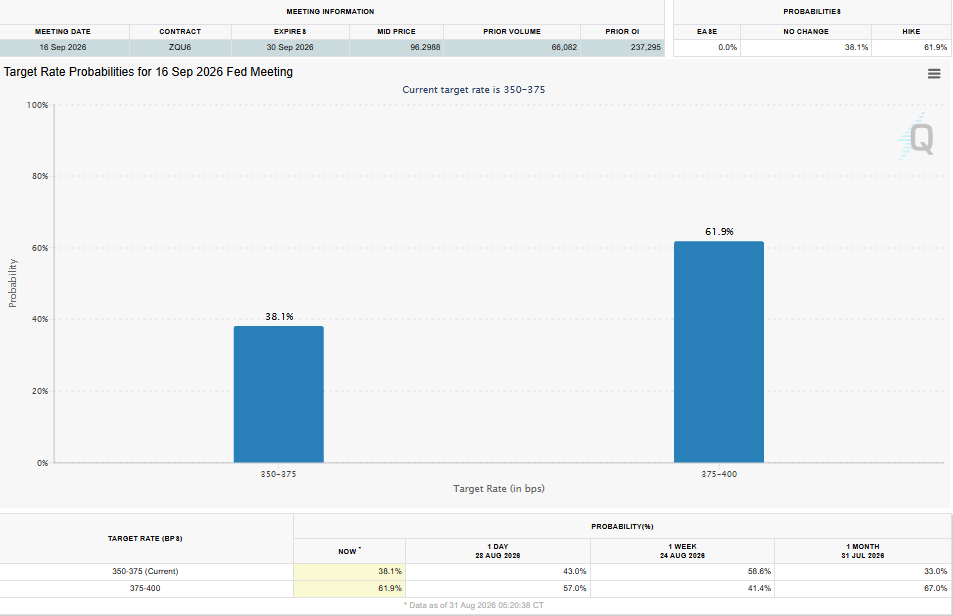
The rise in oil prices has fueled expectations that the Fed could maintain a tighter monetary policy stance, with the bank's funds futures indicating just over a 61.9% probability of a rate hike in September, up from 41.43% last week on Monday, potentially supporting USD bulls and limiting upside in risk assets such as BTC.
Bitcoin technical outlook: Faces rejection from 50-week SMA
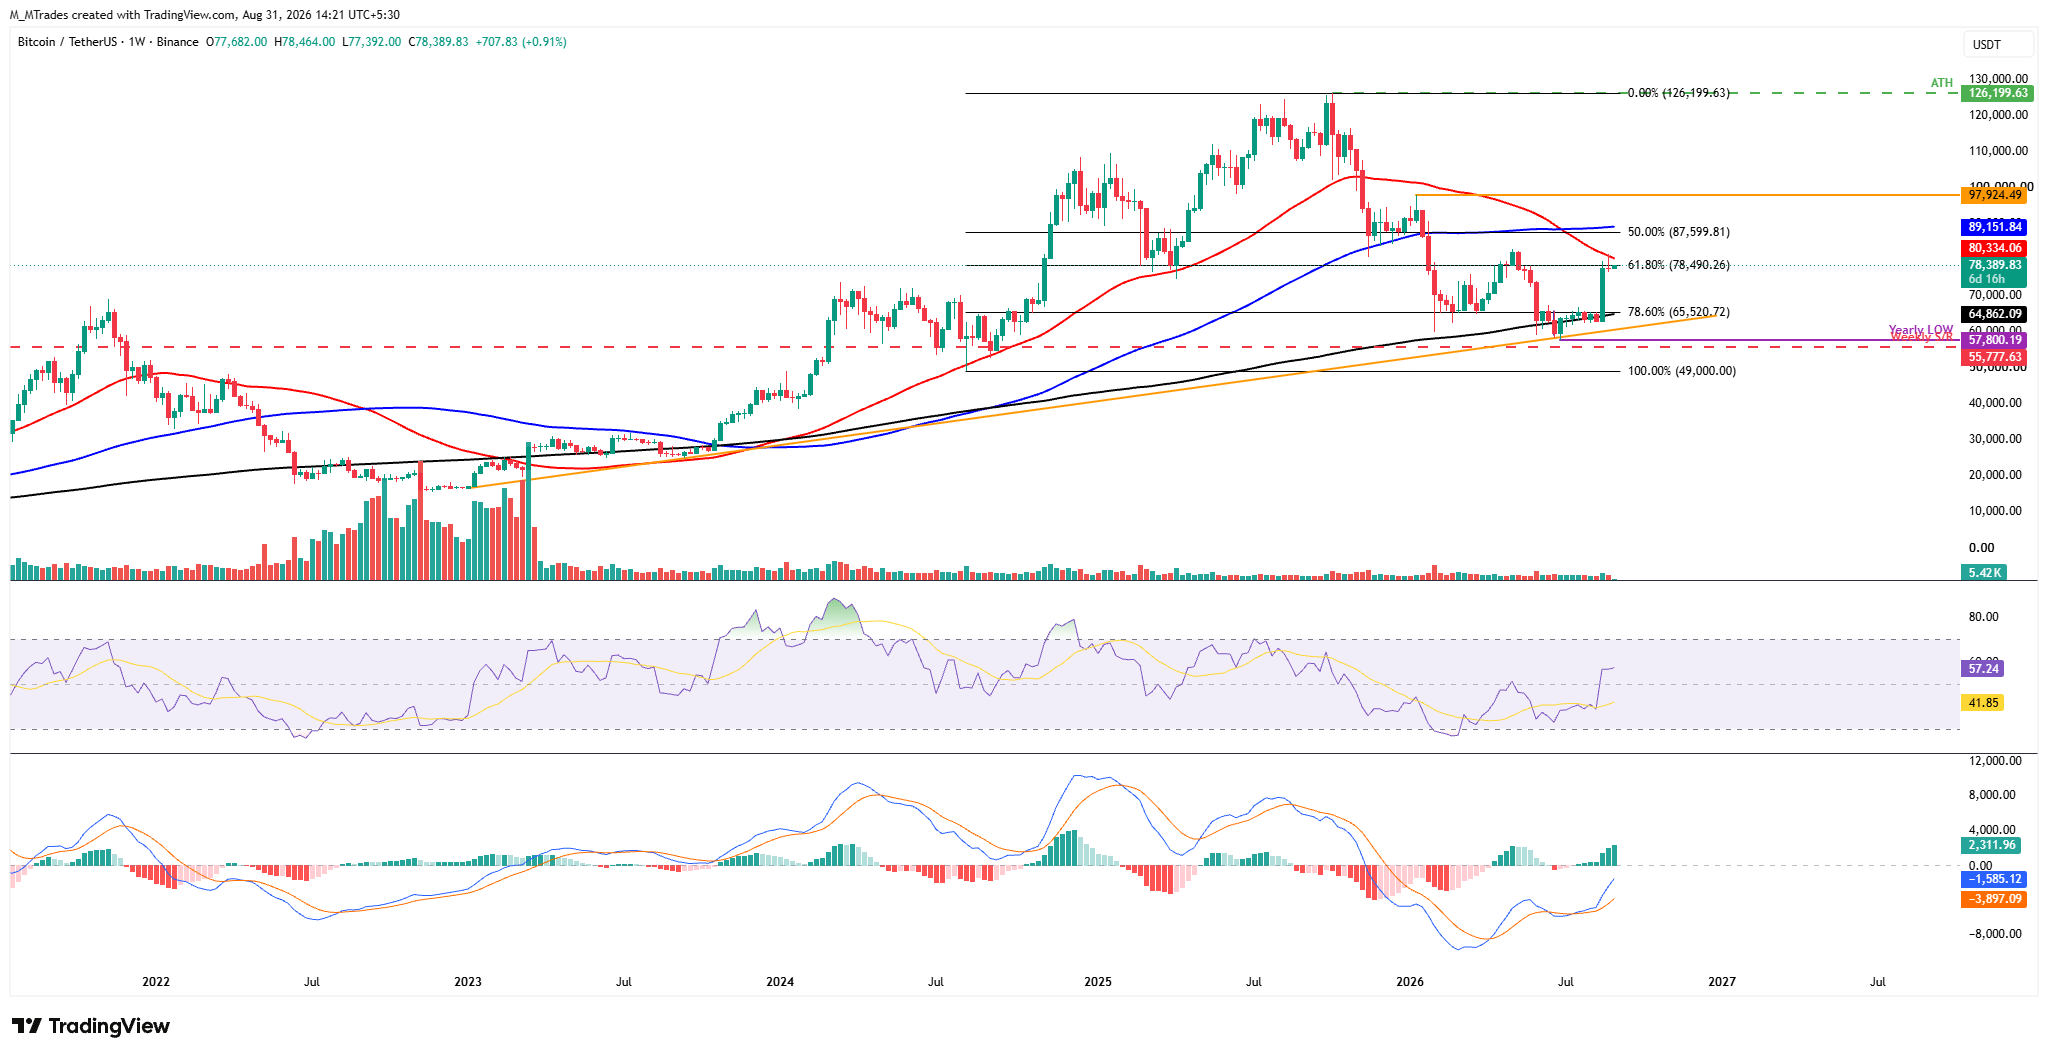
The Crypto King faced rejection after testing the 50-week Simple Moving Average (SMA) at $80,334 and closed the last week with a mild pullback. At the start of this week on Monday, BTC is trading slightly up at around $78,300.
If BTC closes above the immediate resistance at the 50-week SMA at $80,334 on a weekly basis, it could extend the rally toward the 50% Fibonacci retracement level at $87,599, which roughly coincides with the 100-week SMA at $89,151.
Momentum remains strong and shows signs of optimism. On the weekly chart, the Relative Strength Index (RSI) stays firmly above the neutral level of 50, reading 57 on Monday, indicating improving momentum. In addition, the Moving Average Convergence Divergence (MACD) flipped to a bullish crossover in mid-July and remains intact, with rising green histogram bars, supporting a positive outlook.
If BTC corrects, it could extend the decline toward the key psychological level of $70,000.
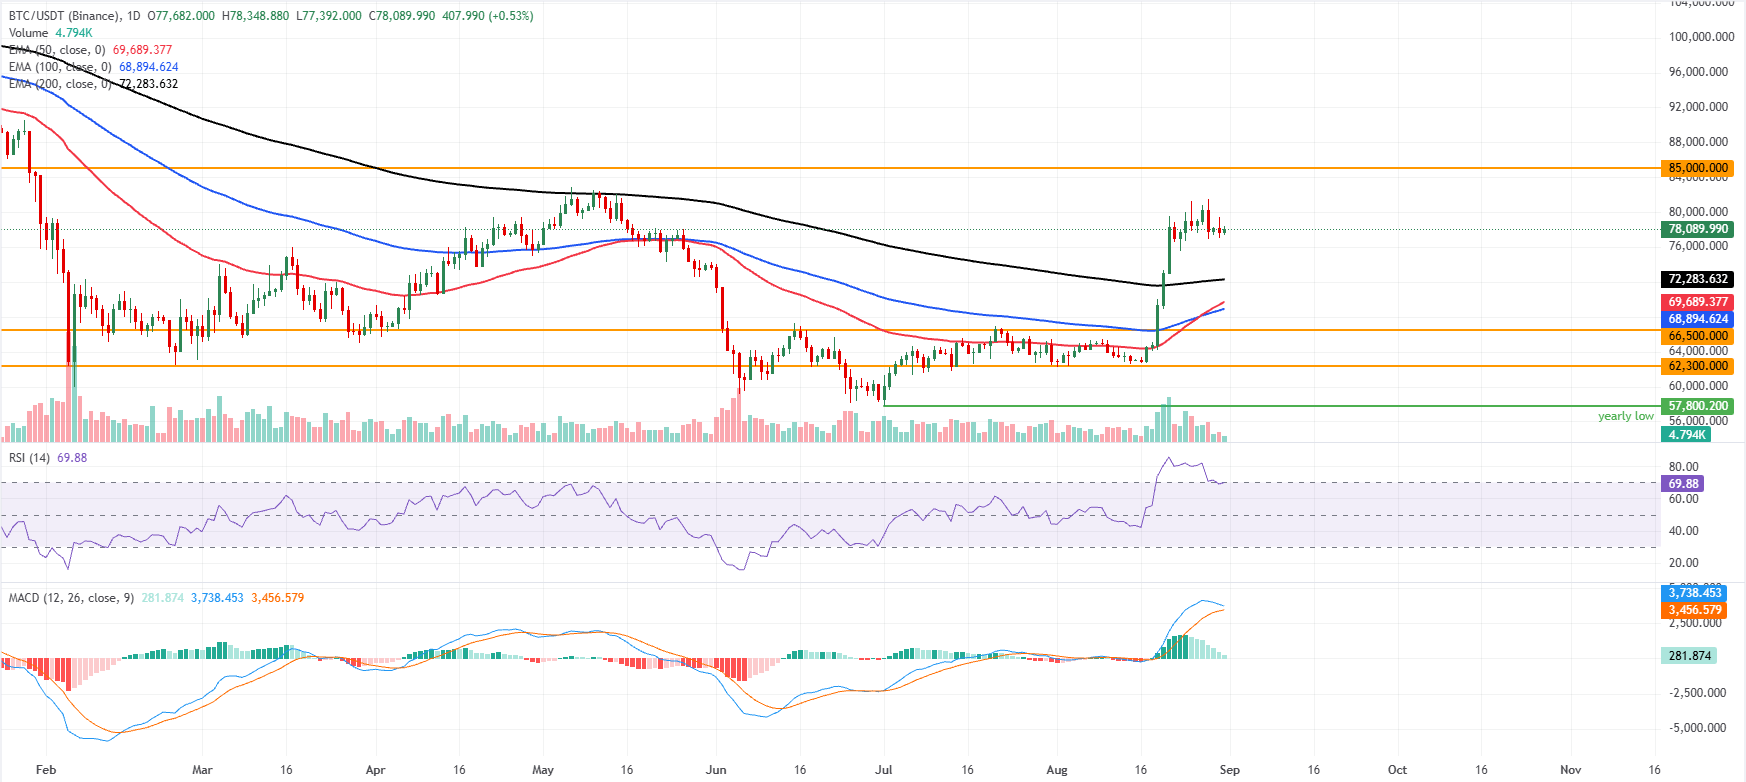
On the daily chart, BTC maintains a bullish near-term bias as price holds well above the 50-day, 100-day, and 200-day Exponential Moving Averages (EMAs) clustered between roughly $68,900 and $72,300.
The RSI at 69 hovers just below overbought territory, while the MACD remains positive but has cooled, suggesting that upside momentum is still constructive but less aggressive than during the recent spike.
On the downside, initial demand appears around the 200-day EMA at $72,283, then the 50-day EMA at $69,689, followed by the 100-day EMA at $68,894; below these, deeper support emerges at the previously charted horizontal levels of $66,500 and $62,300.
(The technical analysis of this story was written with the help of an AI tool. Know more.)
Bitcoin, altcoins, stablecoins FAQs
Bitcoin is the largest cryptocurrency by market capitalization, a virtual currency designed to serve as money. This form of payment cannot be controlled by any one person, group, or entity, which eliminates the need for third-party participation during financial transactions.
Altcoins are any cryptocurrency apart from Bitcoin, but some also regard Ethereum as a non-altcoin because it is from these two cryptocurrencies that forking happens. If this is true, then Litecoin is the first altcoin, forked from the Bitcoin protocol and, therefore, an “improved” version of it.
Stablecoins are cryptocurrencies designed to have a stable price, with their value backed by a reserve of the asset it represents. To achieve this, the value of any one stablecoin is pegged to a commodity or financial instrument, such as the US Dollar (USD), with its supply regulated by an algorithm or demand. The main goal of stablecoins is to provide an on/off-ramp for investors willing to trade and invest in cryptocurrencies. Stablecoins also allow investors to store value since cryptocurrencies, in general, are subject to volatility.
Bitcoin dominance is the ratio of Bitcoin's market capitalization to the total market capitalization of all cryptocurrencies combined. It provides a clear picture of Bitcoin’s interest among investors. A high BTC dominance typically happens before and during a bull run, in which investors resort to investing in relatively stable and high market capitalization cryptocurrency like Bitcoin. A drop in BTC dominance usually means that investors are moving their capital and/or profits to altcoins in a quest for higher returns, which usually triggers an explosion of altcoin rallies.
Author

Manish Chhetri
FXStreet
Manish Chhetri is a crypto specialist with over four years of experience in the cryptocurrency industry.