Pi Network Price Forecast: Weak momentum and waning demand reinforce downside bias
- Pi Network edges lower on Monday, risking a break below its immediate near-term support around $0.0774.
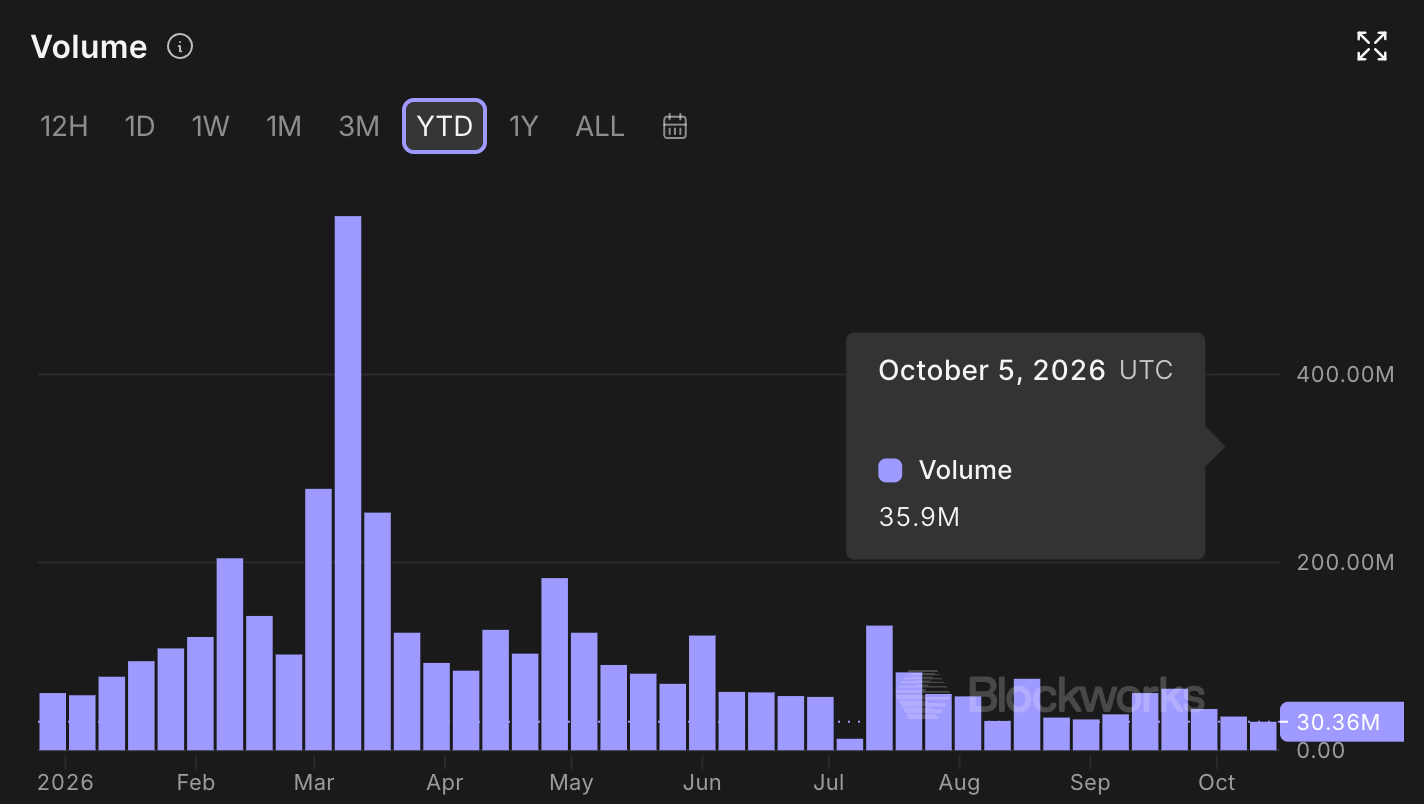
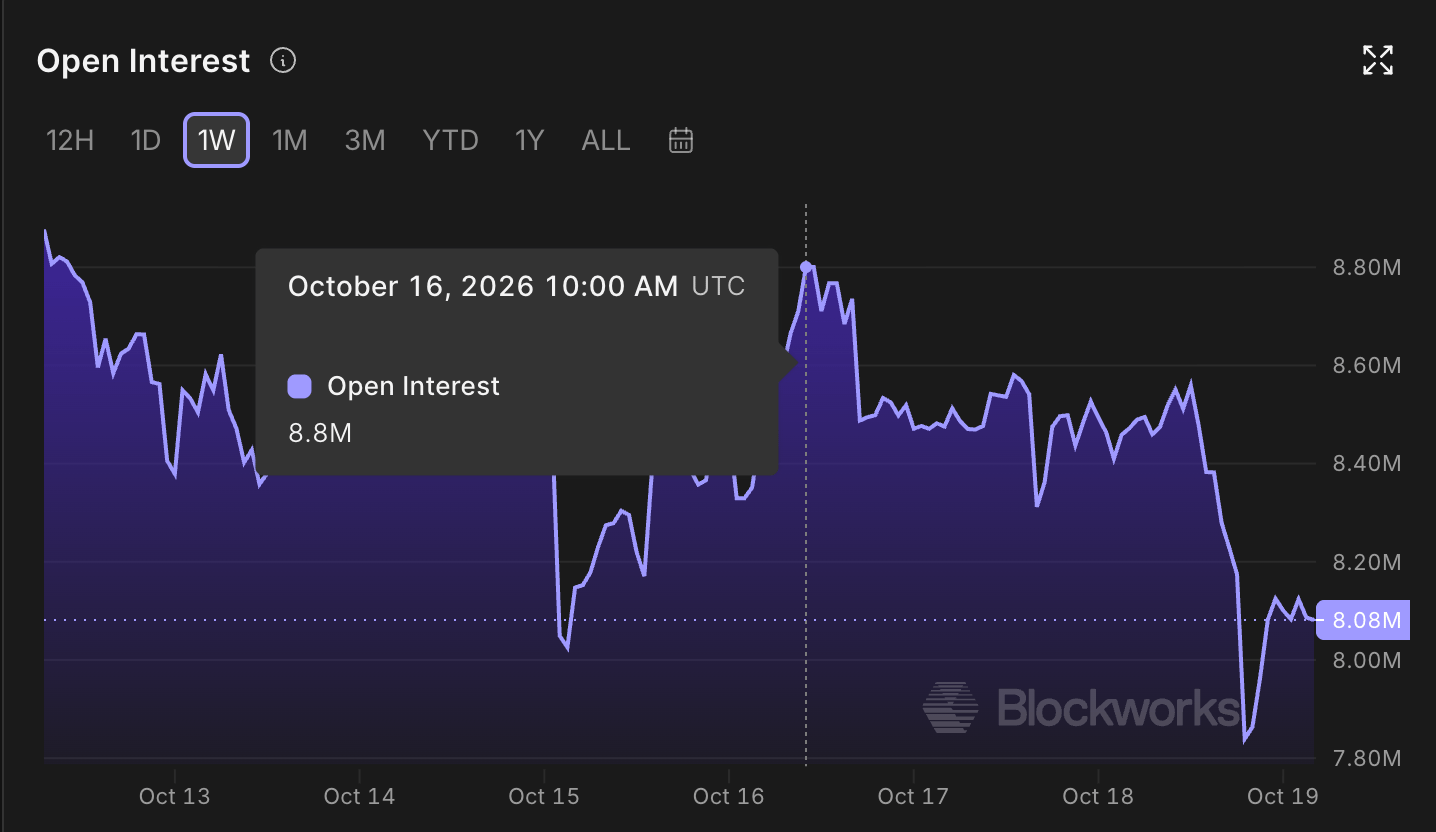
- Declining PI futures Open Interest and weekly spot trading volume suggest reduced demand among traders.
- The technical outlook for PI indicates a downside bias as momentum remains weak.

Pi Network (PI) edges lower on Monday, risking a bearish conclusion to its short-term consolidation above the $0.0774 horizontal support. A steady decline in the notional value of active PI futures contracts and the weekly spot trading volume suggests reduced retail demand. The PI token risks a retest of its record low around $0.0704 as bearish momentum remains dominant on the daily chart.
Pi Network loses retail support
Pi Network is in a long-term bearish trend, weighing on investors' confidence. Blockworks data shows PI is losing demand in the retail space, with weekly spot trading volume dropping to 30.36 million last week, extending a steady decline over the last four weeks after the $65.52 million peak in late September.
Similarly, the derivatives market is seeing reduced demand in PI futures. Blockworks data shows PI futures Open Interest (OI) is down to $8.08 million on Monday, from $8.80 million on Friday, suggesting a lower notional value of active contracts, driven by a lower spot price or a positional wipeout.
Technical outlook: Will Pi Network extend its decline to a fresh record low?
Pi Network trades around $0.0786 at press time on Monday, maintaining a long-term bearish bias. The PI token remains capped beneath the 50-day Exponential Moving Average (EMA) at $0.0865 and the broken downward trendline, which connects the June 20 and August 22 highs, at $0.0843.
From a technical perspective, the 23.6% Fibonacci retracement level, measured from $0.1394 to $0.0704, at $0.0866 reinforces the overhead barrier near the declining resistance trendline. To reinstate an upward trend, PI must surpass the 50-day EMA at $0.0865, which could extend the recovery toward the 50% retracement level at $0.1049.
The Relative Strength Index (RSI) at 37 signals soft but not extreme downside momentum, and the Moving Average Convergence Divergence (MACD) line remains marginally below its signal line, which together hint that sellers still retain control.
On the downside, the immediate technical floor is at the October 8 low of $0.0774, guarding the Fibonacci anchor at $0.0704. A decisive break beneath this structural low would open the door to a deeper bearish extension into untested waters.
(The technical analysis of this story was written with the help of an AI tool. Know more.)
Author

Vishal Dixit
FXStreet
Vishal Dixit holds a B.Sc. in Chemistry from Wilson College but found his true calling in the world of crypto.