|

$BABA confirms Elliott Wave with spot-on blue box reversal

In this technical blog, we are going to take a look at the past performance of BABA 1-Hour Elliott wave Charts that we presented to our members. In which, the decline from 3.18.2026 high took place in an impulse sequence and showed a lower sequence calling for more downside to happen. Therefore, our members knew that selling the bounce in the direction of the right side tag remained the preferred path. We will explain the Elliott wave structure & selling opportunity our members took below:

BABA one-hour Elliott Wave chart from 3.25.2026

Chart

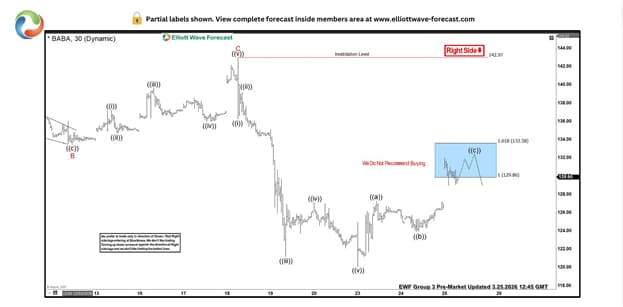
BABA 1-Hour Elliott Wave Chart from 3.25.2026 update. In which,  the stock made a bounce towards the blue box area. The internals of that bounce unfolded as zigzag structure where wave ((a)) ended at $127.27 high. Wave ((b)) pullback ended at $123.92 low. And wave ((c)) managed to reach the blue box area at $129.86- $133.58. From there, sellers were expected to appear looking for further downside or a minimum 3-wave reaction lower.

BABA latest one-hour Elliott Wave chart from 3.31.2026

Chart

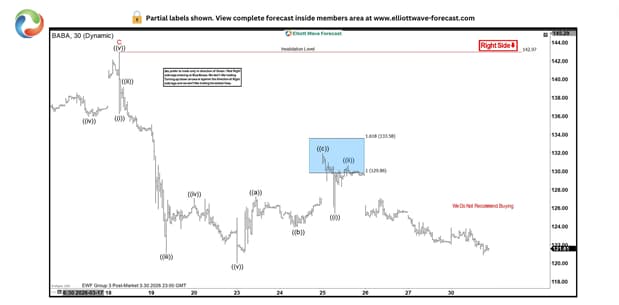
This is the latest 1-Hour view from the 3.30.2026 update. In which the BABA is showing a reaction lower taking place from the blue box area. Allowing shorts to get into a risk-free position shortly after taking the position. However, a break below $121.70 low is needed to confirm the next extension lower & avoid double correction lower.

Author

Elliott Wave Forecast Team

Elliott Wave Forecast Team

ElliottWave-Forecast.com

More from Elliott Wave Forecast Team
Share:

Editor's Picks

GBP/USD flies to two-week highs, targets 1.3400

GBP/USD trades well above the 1.3300 barrier on Thursday as the Greenback comes under renewed selling pressure following a softer-than-expected US NFP report in June. Meanwhile, Cable extends its multi-day recovery and looks to challenge 1.3400 sooner rather than later.

EUR/USD: Signs of life emerge above 1.1400

EUR/USD leaves behind two daily pullbacks in a row and advances to multi-day peaks near 1.1470 on Thursday, partially offsetting the sharp decline in place since June. The pair’s decline follows the intense retracement in the US Dollar, which is particularly sponsored by disheartening prints from June’s Payrolls and the sharp sell-off in USD/JPY. The US markets will be closed on Friday due to the Independence Day holiday.

Gold hits six-day tops past $4,100

Gold extends its bullish momentum on Thursday, climbing above the $4,100 mark per troy ounce to reach its highest level in a week. The precious metal’s sharp rebound comes as the US Dollar retreats following disappointing US NFP data.

Strategy's STRC volatility points to late Bitcoin cycle reset — Bitwise
The recent volatility surrounding Strategy's perpetual preferred stock, STRC, could signal that Bitcoin (BTC) is approaching a cycle bottom, according to Bitwise CIO Matt Hougan. In a Wednesday report, Hougan argued that the sharp decline in STRC and Strategy's MSTR stock should be viewed as "classic end-of-cycle dynamics" rather than evidence of a broader structural threat to Bitcoin.
The market may no longer be giving the Magnificent Seven a free pass
For much of the past three years, investing has felt surprisingly simple. Whenever markets stumbled, investors knew where to look. Apple, Microsoft, Nvidia, Amazon, Alphabet, Meta and Tesla repeatedly led Wall Street higher, shrugging off inflation fears, higher interest rates and geopolitical shocks.
Kevin Warsh offers no policy clues: Why markets still got their answer

Financial markets came to Sintra looking for clues about the Federal Reserve's (Fed) next move. They largely left with confirmation that Fed Chair Kevin Warsh intends to make those clues much harder to find.