AUD/USD trims some losses but remains capped below the 0.6450 resistance area
- AUD/USD bounced up on stronger-than-expected Australian inflation figures.
- The pair maintains its immediate bearish trend intact, with bulls capped below 0.6450-0.6460.
- The daily chart features an "evening Star" pattern, a bearish sign.

The Aussie Dollar is posting marginal gains on Wednesday following a 0.70% decline during the last two days. The above expectations Australian CPI reading has provided some support to the Aussie, but it still remains below the 0.645-0.6460 resistance area, which leaves the bearish trend intact.
Data released earlier on Wednesday revealed that the Australian CPI remained steady at a 2.4% yearly rate, against market expectations of a slight decline to 2.3%. The RBA’s preferred trimmed mean gauge accelerated to 2.8% from 2.7% in the previous month.
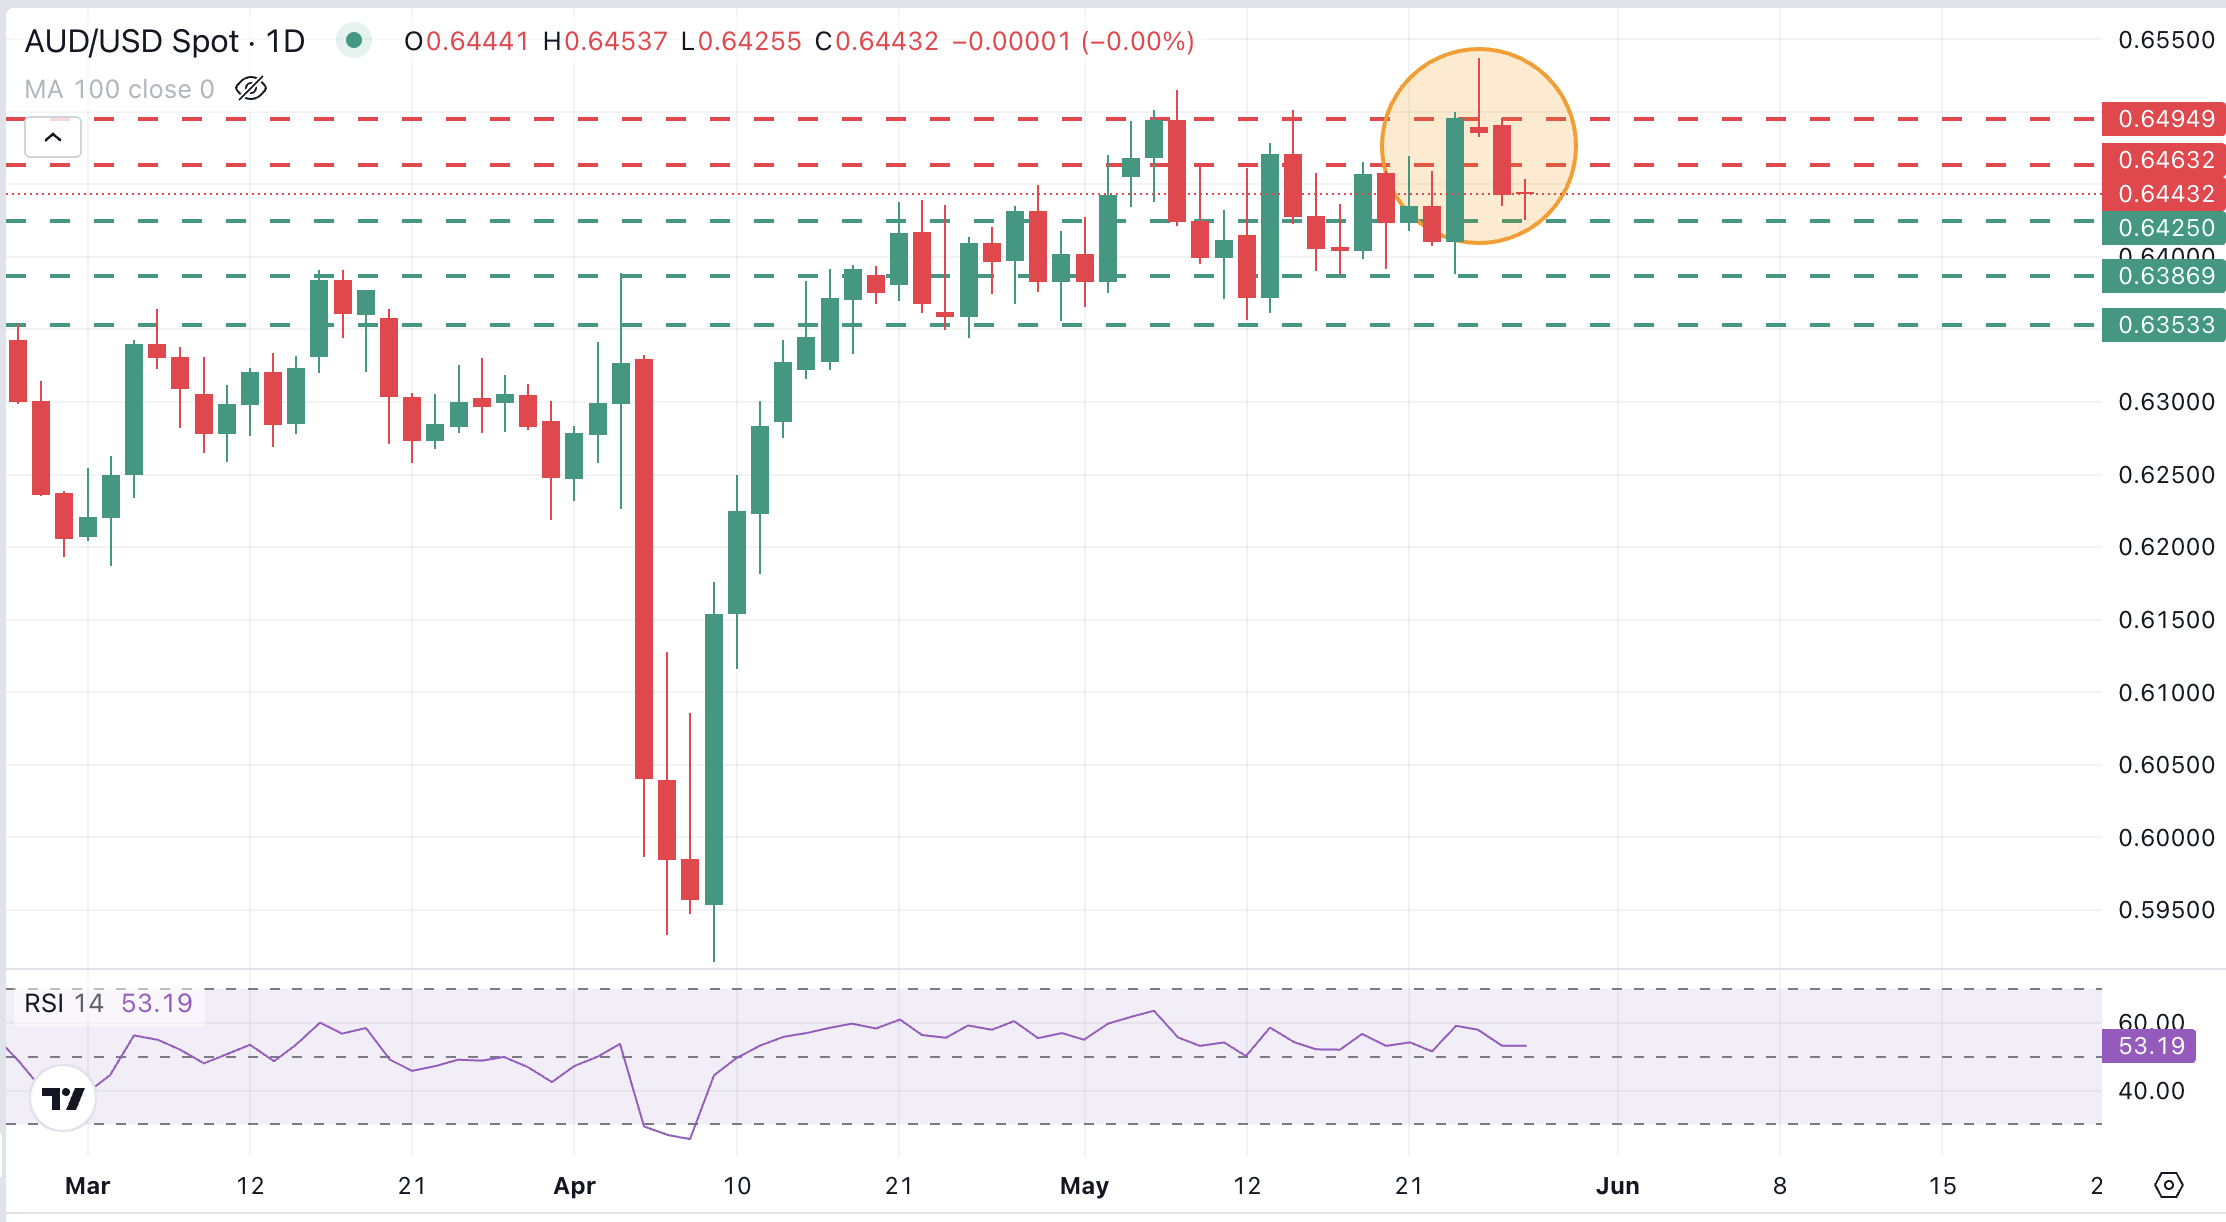
AUD/USD shows an Evening Star in the daily chart
Tuesday’s impulsive bearish reaction, coupled with Monday´s Doji candle, has completed an “Evening Star” candle formation at the top of the rally from Early April lows. This is a bearish sign that often anticipates trend reversals.
Price action has been showing hesitation over the latest session, with bulls capped below the 0.6450-0.5460 resistance area (intraday levels), which closes the path towards the May 27 high, at 0.6495.
Failure to break above here would put the 0.6225 back in play.
Below here, the next support levels are 0.6390 (May 16 low) and the 0.6340 -0.6360 area.
AUD/USD Daily Chart
Inflation FAQs
Inflation measures the rise in the price of a representative basket of goods and services. Headline inflation is usually expressed as a percentage change on a month-on-month (MoM) and year-on-year (YoY) basis. Core inflation excludes more volatile elements such as food and fuel which can fluctuate because of geopolitical and seasonal factors. Core inflation is the figure economists focus on and is the level targeted by central banks, which are mandated to keep inflation at a manageable level, usually around 2%.
The Consumer Price Index (CPI) measures the change in prices of a basket of goods and services over a period of time. It is usually expressed as a percentage change on a month-on-month (MoM) and year-on-year (YoY) basis. Core CPI is the figure targeted by central banks as it excludes volatile food and fuel inputs. When Core CPI rises above 2% it usually results in higher interest rates and vice versa when it falls below 2%. Since higher interest rates are positive for a currency, higher inflation usually results in a stronger currency. The opposite is true when inflation falls.
Although it may seem counter-intuitive, high inflation in a country pushes up the value of its currency and vice versa for lower inflation. This is because the central bank will normally raise interest rates to combat the higher inflation, which attract more global capital inflows from investors looking for a lucrative place to park their money.
Formerly, Gold was the asset investors turned to in times of high inflation because it preserved its value, and whilst investors will often still buy Gold for its safe-haven properties in times of extreme market turmoil, this is not the case most of the time. This is because when inflation is high, central banks will put up interest rates to combat it. Higher interest rates are negative for Gold because they increase the opportunity-cost of holding Gold vis-a-vis an interest-bearing asset or placing the money in a cash deposit account. On the flipside, lower inflation tends to be positive for Gold as it brings interest rates down, making the bright metal a more viable investment alternative.
Author

Guillermo Alcala
FXStreet
Graduated in Communication Sciences at the Universidad del Pais Vasco and Universiteit van Amsterdam, Guillermo has been working as financial news editor and copywriter in diverse Forex-related firms, like FXStreet and Kantox.


