AUD/USD Price Forecast: Next support is 78.6% Fibo level near 0.6600
- AUD/USD holds onto losses near 0.6645 as the US Dollar continues to rally.
- The US Dollar remains upbeat due to hawkish Fed undertone.
- Market experts doubt the continuation of RBA’s monetary tightening cycle.


The Australian Dollar (AUD) trades near its fresh almost 11-month low at around 0.6645 against the US Dollar (USD) during the early European trading session on Friday. The Aussie pair is under pressure as the US Dollar outperforms due to hawkish Federal Reserve (Fed) narrative and continued weakness in the antipodean due to hopes that the Reserve Bank of Australia’s (RBA) monetary tightening cycle has come to an end.
US Dollar Price This week
The table below shows the percentage change of US Dollar (USD) against listed major currencies this week. US Dollar was the strongest against the Australian Dollar.
| USD | EUR | GBP | JPY | CAD | AUD | NZD | CHF | |
|---|---|---|---|---|---|---|---|---|
| USD | 0.44% | 0.84% | -0.35% | 0.50% | 1.64% | 0.63% | 0.40% | |
| EUR | -0.44% | 0.37% | -0.75% | 0.01% | 1.18% | 0.14% | -0.08% | |
| GBP | -0.84% | -0.37% | -1.11% | -0.36% | 0.80% | -0.24% | -0.45% | |
| JPY | 0.35% | 0.75% | 1.11% | 0.69% | 1.92% | 0.83% | 0.72% | |
| CAD | -0.50% | -0.01% | 0.36% | -0.69% | 1.25% | 0.15% | -0.09% | |
| AUD | -1.64% | -1.18% | -0.80% | -1.92% | -1.25% | -1.03% | -1.24% | |
| NZD | -0.63% | -0.14% | 0.24% | -0.83% | -0.15% | 1.03% | -0.22% | |
| CHF | -0.40% | 0.08% | 0.45% | -0.72% | 0.09% | 1.24% | 0.22% |
The heat map shows percentage changes of major currencies against each other. The base currency is picked from the left column, while the quote currency is picked from the top row. For example, if you pick the US Dollar from the left column and move along the horizontal line to the Japanese Yen, the percentage change displayed in the box will represent USD (base)/JPY (quote).
As of writing, the US Dollar Index (DXY), which gauges the Greenback’s value against six major currencies, is down 0.12% to near 103.80, but is close to its fresh 19-month of 104.00 posted the previous day.
Fed hawks keep two-hike baseline but flag risk of larger move
Economists at UOB Group interpret the latest policy signals as reinforcing a firmly hawkish Fed stance and “maintaining our view of two more rate hikes (Dec and 1Q 2027), while recognizing rising risks of an outsized hike.” They note that at the 27–28 Oct 2026 FOMC meeting, policymakers “decided to maintain the Fed Funds Target Rate (FFTR) at 3.75–4.00%, following the 25-bps increase delivered in September.” While the decision to leave rates unchanged was approved by a “10–2 vote,” the minutes showed that “almost all participants viewed further policy tightening as likely to be appropriate in coming months under their baseline outlooks.”
According to UOB, the October FOMC minutes “confirmed a firmly hawkish consensus, with almost all participants judging that additional tightening would be needed under their baseline outlooks for inflation and the labor market.” That tone was reinforced by subsequent Fed commentary: in a CNBC interview on Wed (18 Nov), Fed Governor Waller, described as a “permanent voter,” “escalated the policy debate by urging officials to consider a 50 bps hike at the Dec FOMC meeting, citing annualized inflation running near 3.5% in the last three months and that inflation is headed in the wrong direction and spreading beyond energy.”
Against this backdrop, UOB reiterates that “we continue to emphasize we do not think this is a ‘one-and-done hike’ from the Fed, and as per previous rate hike cycles, the Fed usually does not stop at one.” At the same time, they stress, “we do not believe this is the start of a long series of hikes.” As such, the bank says, “we still expect two additional 25-bps hikes, in Dec 2026 and 1Q 27, thereafter on hold for the rest of 2027 as inflation fades in a more durable fashion in the later part of 2027 as the most likely course of action,” while “recognising growing risks of a larger-than-expected tightening response if inflation remains persistent.”
Aussie labour market softens as RBA seen less likely to hike again
Analysts at Rabobank highlight that the RBA is now confronting an Australian economy where “unemployment is spiking (from 4.7% to 4.9%) and jobs growth was -43.5K vs. an expected +25K,” developments that, in their view, are “making further rate hikes less likely.” They caution, however, that next week’s October CPI release “could still show a sharp headline lift,” leaving the policy outlook finely balanced even as softer labour market data temper expectations for additional tightening.
AUD/USD Technical Analysis
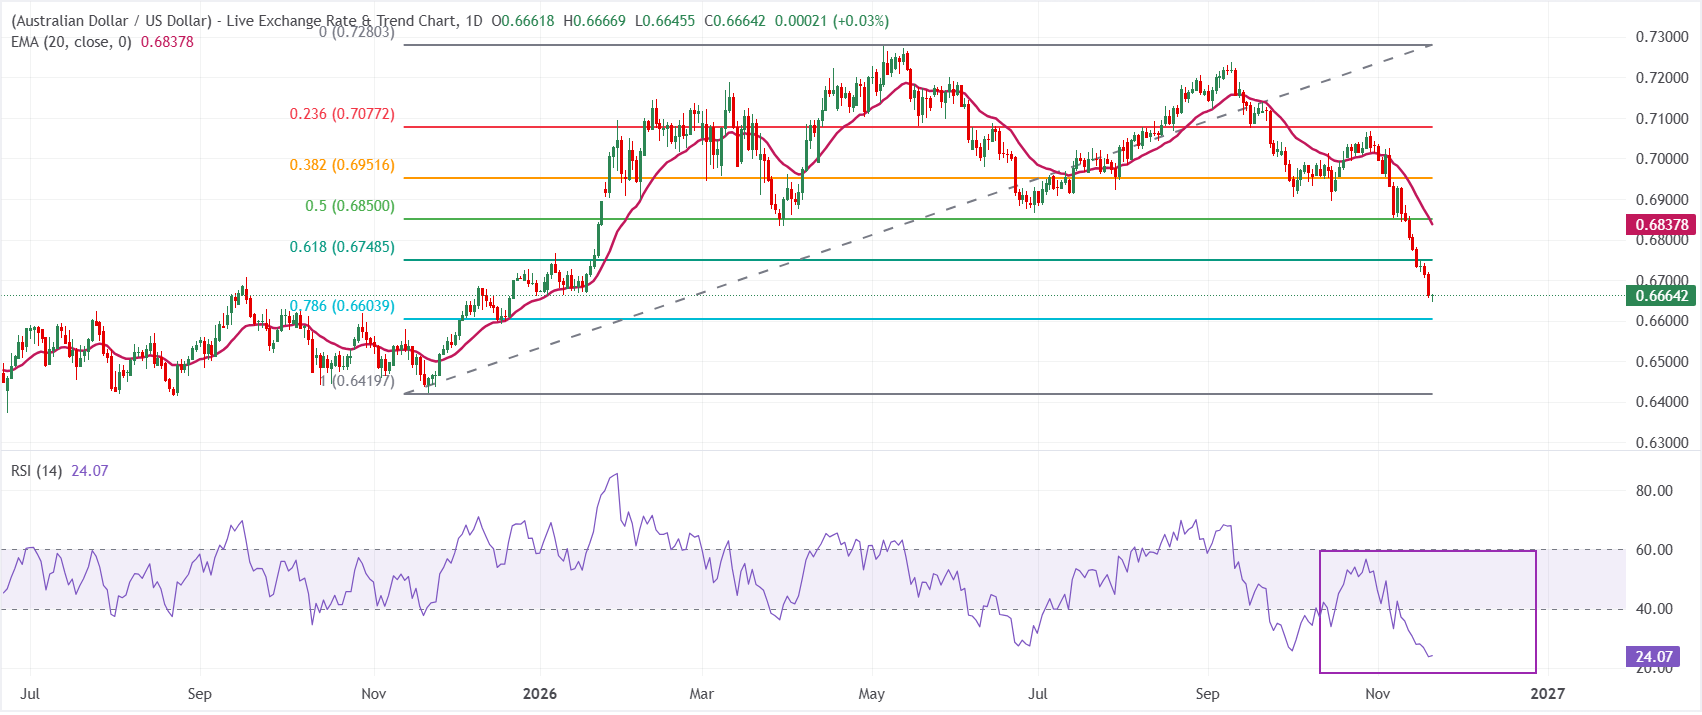
In the daily chart, AUD/USD trades at 0.6665, holding a clear bearish bias as spot remains below the 20-period exponential moving average (EMA) at 0.6838 and under key Fibonacci retracement levels. The Relative Strength Index (14) sits near oversold territory around 24, which hints at stretched downside momentum but has yet to translate into a meaningful rebound while price stays capped beneath this layered resistance.
On the topside, initial resistance emerges at the 61.8% Fibonacci retracement at 0.6748, followed by the 20-day EMA at 0.6838 and the 50% retracement near 0.6850, with higher hurdles at the 38.2% level around 0.6952 and 0.7077. On the downside, immediate support is seen at the 78.6% retracement at 0.6604, with a break there exposing the lower Fibonacci anchor around 0.6420 as the next potential bearish target.
(The technical analysis of this story was written with the help of an AI tool. Know more.)
Economic Indicator
Unemployment Rate s.a.
The Unemployment Rate, released by the Australian Bureau of Statistics, is the number of unemployed workers divided by the total civilian labor force, expressed as a percentage. If the rate increases, it indicates a lack of expansion within the Australian labor market and a weakness within the Australian economy. A decrease in the figure is seen as bullish for the Australian Dollar (AUD), while an increase is seen as bearish.
Read more.Last release: Thu Nov 19, 2026 00:30
Frequency: Monthly
Actual: 4.9%
Consensus: 4.7%
Previous: 4.7%
Source: Australian Bureau of Statistics
The Australian Bureau of Statistics (ABS) publishes an overview of trends in the Australian labour market, with unemployment rate a closely watched indicator. It is released about 15 days after the month end and throws light on the overall economic conditions, as it is highly correlated to consumer spending and inflation. Despite the lagging nature of the indicator, it affects the Reserve Bank of Australia’s (RBA) interest rate decisions, in turn, moving the Australian dollar. Upbeat figure tends to be AUD positive.
Author
Sagar Dua
FXStreet
Sagar Dua is associated with the financial markets from his college days. Along with pursuing post-graduation in Commerce in 2014, he started his markets training with chart analysis.