AUD/USD Price Forecast: Bearish bias persists below 0.7000
- AUD/USD gains as weaker-than-expected US Nonfarm Payrolls data weigh on the Greenback.
- Technically, AUD/USD remains bearish while attempting to stabilize above the 200-day SMA.
- Immediate resistance is seen at 0.7000, followed by the 100-day SMA.

The Australian Dollar (AUD) trades on the front foot against the US Dollar (USD) on Thursday as a weaker-than-expected US Nonfarm Payrolls (NFP) report pushed back expectations of an imminent Federal Reserve (Fed) interest rate hike. However, AUD/USD remains confined within a one-week trading range, with technical indicators pointing to limited upside momentum.
At the time of writing, AUD/USD trades around 0.6918 after hitting an intraday high of 0.6943, its highest level since June 23.
Data released by the US Bureau of Labor Statistics (BLS) showed the US economy added just 57K jobs in June, well below market expectations of 110K. Meanwhile, May's payrolls were revised down to 129K from the previously reported 172K.
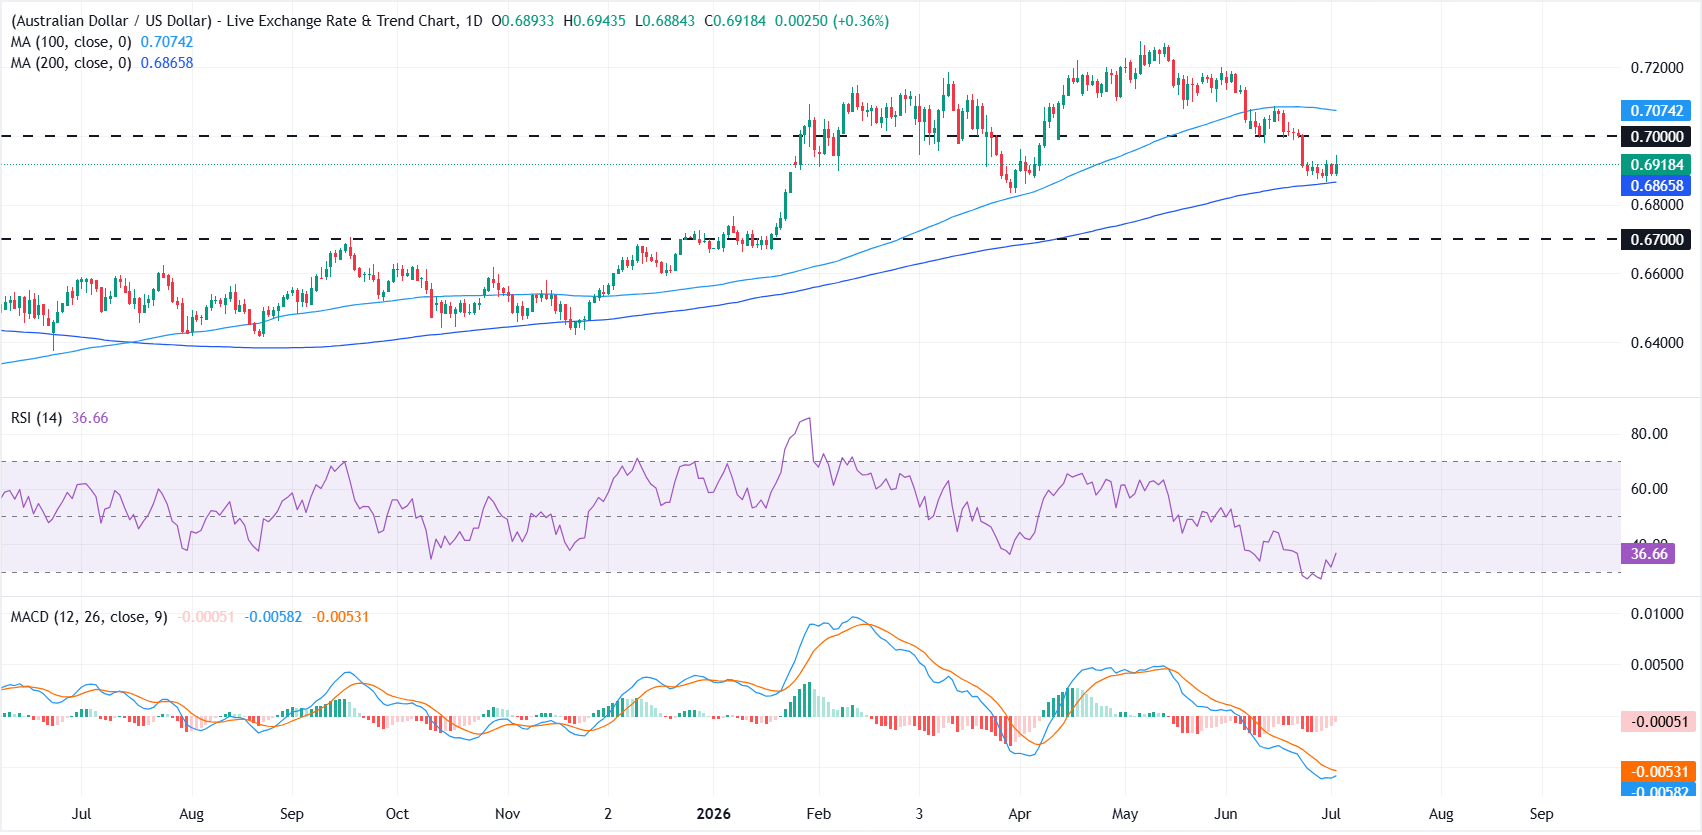
From a technical perspective, AUD/USD is attempting to establish support above the 200-day Simple Moving Average (SMA) at 0.6865. Even so, the near-term technical picture remains bearish, with the pair posting a series of lower highs and lower lows since peaking at 0.7277 in early May while trading below the 100-day SMA at 0.7074.
On the topside, immediate resistance is seen at the psychological 0.7000 level. A break above this barrier could pave the way for a test of the 100-day Simple Moving Average (SMA) at 0.7074. Only a sustained move above this resistance zone would ease the bearish pressure and open the door for a more constructive recovery phase.
The Relative Strength Index (RSI) has recovered to around 37 after slipping into oversold territory, while the Moving Average Convergence Divergence (MACD) remains below the zero line, although the fading red histogram suggests downside momentum is easing. Even so, there are few signs of a meaningful trend reversal, indicating that any rebounds are likely to remain shallow while AUD/USD stays below the 0.7000 region.
US Dollar Price Today
The table below shows the percentage change of US Dollar (USD) against listed major currencies today. US Dollar was the strongest against the Canadian Dollar.
| USD | EUR | GBP | JPY | CAD | AUD | NZD | CHF | |
|---|---|---|---|---|---|---|---|---|
| USD | -0.47% | -0.52% | -0.95% | -0.25% | -0.36% | -0.43% | -0.73% | |
| EUR | 0.47% | -0.05% | -0.48% | 0.21% | 0.11% | 0.07% | -0.25% | |
| GBP | 0.52% | 0.05% | -0.43% | 0.24% | 0.16% | 0.14% | -0.20% | |
| JPY | 0.95% | 0.48% | 0.43% | 0.68% | 0.59% | 0.50% | 0.22% | |
| CAD | 0.25% | -0.21% | -0.24% | -0.68% | -0.10% | -0.15% | -0.47% | |
| AUD | 0.36% | -0.11% | -0.16% | -0.59% | 0.10% | -0.04% | -0.37% | |
| NZD | 0.43% | -0.07% | -0.14% | -0.50% | 0.15% | 0.04% | -0.32% | |
| CHF | 0.73% | 0.25% | 0.20% | -0.22% | 0.47% | 0.37% | 0.32% |
The heat map shows percentage changes of major currencies against each other. The base currency is picked from the left column, while the quote currency is picked from the top row. For example, if you pick the US Dollar from the left column and move along the horizontal line to the Japanese Yen, the percentage change displayed in the box will represent USD (base)/JPY (quote).
Author

Vishal Chaturvedi
FXStreet
I am a macro-focused research analyst with over four years of experience covering forex and commodities market. I enjoy breaking down complex economic trends and turning them into clear, actionable insights that help traders stay ahead of the curve.