|

AUD/USD Price Analysis: Inch far from 0.6600 as soft Australian CPI cements steady RBA policy

  • AUD/USD has dropped sharply to near 0.6600 as Australian inflation softens further.
  • Soft Australian inflation would support the RBA to stay with the decision of keeping interest rates unchanged.
  • The USD Index is eying an upside break of the consolidation formed in a narrow range above 101.80.

The AUD/USD pair is continuously declining towards the round-level support of 0.6600 after the Australian Bureau of Statistics reported further softening of inflation data. The quarterly Consumer Price Index (CPI) (Q1) accelerated by 1.4% but was lower than the former pace of 1.9%. Annual inflation has softened to 7.0%, a little higher than the estimates of 6.9% but lower than the prior release of 7.8%.

The monthly CPI indicator decelerated to 6.1% from the consensus of 6.6% and the previous release of 6.8%. A significant deceleration in Australian inflation is going to support the Reserve Bank of Australia (RBA) to stay with the decision of keeping interest rates unchanged at 3.60%, as announced in April’s monetary policy meeting.

Meanwhile, the US Dollar Index (DXY) is eying an upside break of the consolidation formed in a narrow range above 101.80. S&P500 futures have added significant gains despite a bearish Tuesday, portraying a recovery in the risk appetite of the market participants.

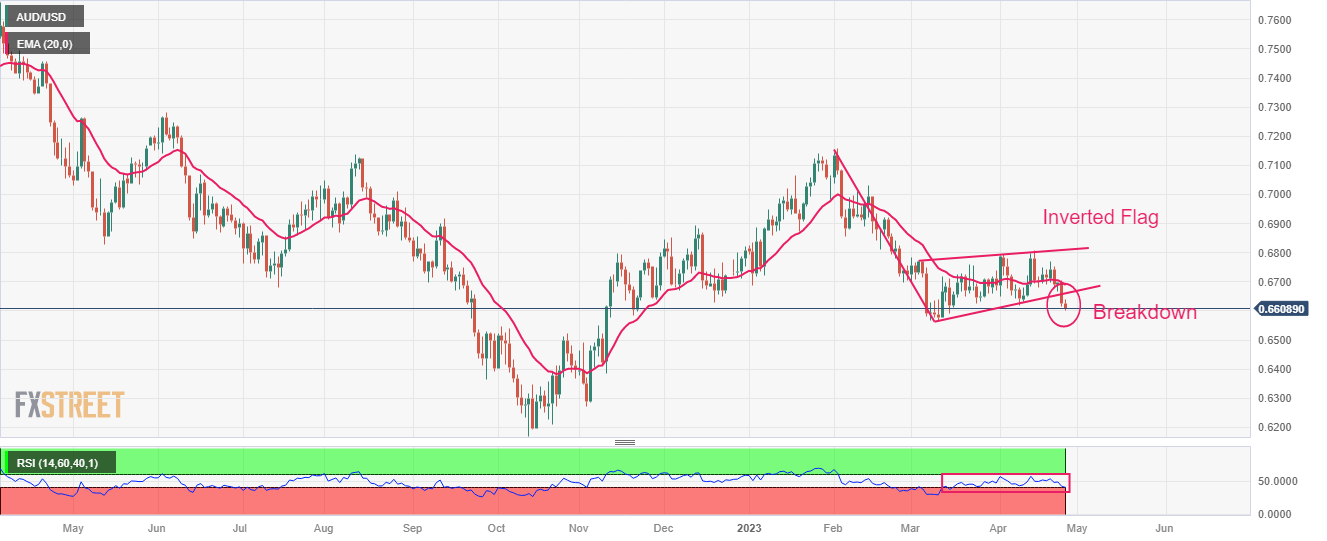
AUD/USD has delivered a breakdown of the Inverted Flag chart pattern formed on a daily scale. The aforementioned chart pattern is a trend continuation pattern in which a long consolidation is followed by a breakdown. Usually, the consolidation phase of the chart pattern serves as an inventory adjustment in which those participants initiate shorts, which prefer to enter an auction after the establishment of a bearish bias and current sellers add more positions.

Going forward, the 20-period Exponential Moving Average (EMA) around 0.6700 will act as a barricade for the Aussie bulls.

Adding to that, a slippage into the bearish range of 20.00-40.00 by the Relative Strength Index (RSI) (14) will trigger a downside momentum.

US Dollar bulls will flex their muscles if the Aussie asset will drop below March 15 low at 0.6590. An occurrence of the same will expose the asset to March 08 low at 0.6568 followed by 02 November 2022 high around 0.6500.

In an alternate scenario, only a decisive move above the round-level resistance of 0.6800 will drive the asset toward February 23 high at 0.6872 and February 20 high at 0.6920.

AUD/USD daily chart
AUD/USD

Overview
Today last price0.6605
Today Daily Change-0.0021
Today Daily Change %-0.32
Today daily open0.6626
 
Trends
Daily SMA200.6702
Daily SMA500.6714
Daily SMA1000.6797
Daily SMA2000.6741
 
Levels
Previous Daily High0.6706
Previous Daily Low0.6614
Previous Weekly High0.6772
Previous Weekly Low0.6678
Previous Monthly High0.6784
Previous Monthly Low0.6564
Daily Fibonacci 38.2%0.6649
Daily Fibonacci 61.8%0.6671
Daily Pivot Point S10.6592
Daily Pivot Point S20.6558
Daily Pivot Point S30.6501
Daily Pivot Point R10.6683
Daily Pivot Point R20.674
Daily Pivot Point R30.6774

Author

Sagar Dua

Sagar Dua

FXStreet

Sagar Dua is associated with the financial markets from his college days. Along with pursuing post-graduation in Commerce in 2014, he started his markets training with chart analysis.


More from Sagar Dua
Share:

Editor's Picks

AUD/USD remains below 0.7000 amid light trading

AUD/USD fills a modest bearish gap on Monday, but remains below 0.7000 in the Asian session amid holiday-thinned liquidity. The US Dollar attempts a bounce even as US bond yields pull back from multi-year highs, limiting the pair. Moreover, diminishing odds of another RBA rate hike in November cap the Aussie.

USD/JPY hovers above 158.00 amid Japan/ US holiday

USD/JPY extends its range-bound price action into a new week, trading above 158.00 as bulls remain on high alert amid speculation that authorities will step in to prop up the Japanese Yen. Meanwhile, softer US bond yields keep US Dollar bulls on the back foot and cap the pair's upside. However, geopolitical uncertainties could limit losses for the safe-haven buck amid thin liquidity due to a holiday in Japan and the US.

Gold sticks to modest losses; seems vulnerable below $4,200 on Fed hike bets

Gold extends its intraday retracement slide from a one-week high, hitting a fresh daily low around $4,170 during the early European session. The US Dollar attracts fresh buyers after a modest downtick amid the US Federal Reserve's hawkish outlook, which, in turn, is seen as weighing on the non-yielding bullion.

Bitcoin struggles as ETF outflows, geopolitical uncertainty weigh

Bitcoin hovers around $83,600 on Monday after a 3.1% correction last week. US-listed spot ETFs recorded an outflow of $681.10 million last week, snapping the three-week inflow streak. Geopolitical uncertainty and mixed signals keep investors cautious.

The week ahead: A critical week as earnings and CPI test market

The Oil price is relatively stable this morning, and US and European stock markets are poised to open higher, as risk sentiment shrugs off an escalation in the Middle East and concerns about rising bond yields.

Has Bitcoin really escaped the macro forces it was built to fight?
Over 17 years ago, Satoshi Nakamoto designed Bitcoin (BTC) on the back of a global financial crisis as an alternative to the global monetary system outside the control of central banks, governments and traditional intermediaries. This raises a key question: has Bitcoin really become independent of the macroeconomic forces it was built to challenge?














