|

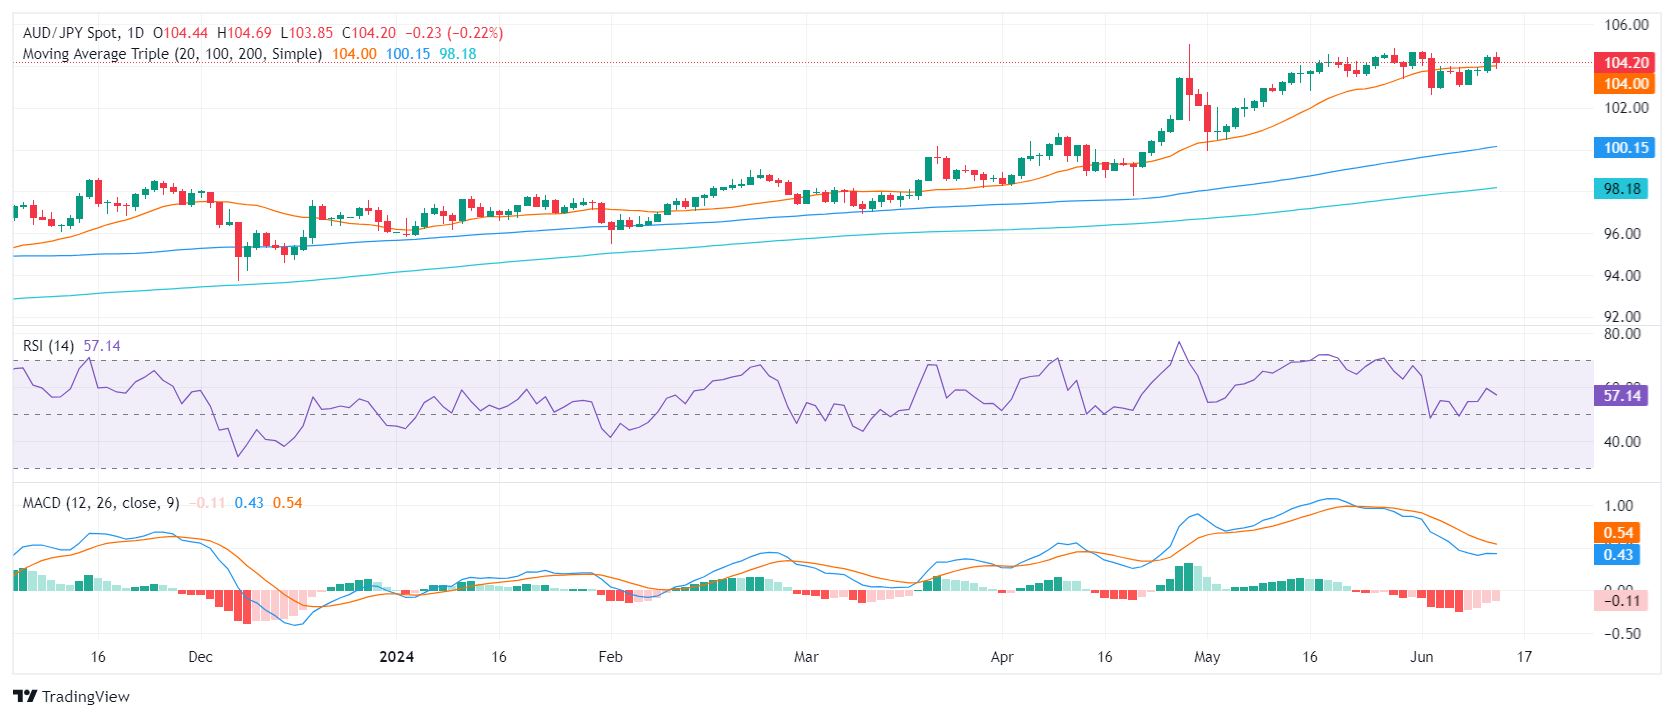
AUD/JPY Price Analysis: Bulls take a breather, sellers test the 20-day SMA support

  • The AUD/JPY pair is experiencing a decline as buyers take profits, causing it to hover around the 20-day SMA.
  • In spite of the drop, the pair remains in consolidation, suggesting the possibility of a limited decline for the time being.
  • If the bulls are successful in building support around the 20-day SMA, the next potential target lies within the 104.50-105.00 price range.

In Thursday's session, the AUD/JPY pair witnessed a dip towards 104.00 as buyers cashed in their profits, which saw the pair soaring above the 20-day Simple Moving Average (SMA). The 20-day SMA, which previously acted as a point of resistance, seems to be the new focus point for building support in order to lessen further losses. Nevertheless, the persistent consolidation phase suggests a lack of momentum for a steady rise.

The daily Relative Strength Index (RSI) of the AUDJPY now stands at 54, a decrease from the previous session's score of 57, indicating a slight downward trend and implying that the previous upward momentum may be losing steam. In contrast, the Moving Average Convergence Divergence (MACD) is exhibiting stationary red bars, indicative of a stabilizing momentum.

AUD/JPY daily chart

In conclusion, the AUD/JPY pair appears to be in a consolidation phase, despite a drop this Thursday as trading hovers around the 20-day SMA. The possible range of 102.00-103.00 for the upcoming sessions may denote the continuation of side-ways trading as bulls seem to be consolidating from the May rally which had lifted the pair near 105.00. Nonetheless, the reduction in selling momentum could represent a gearing up by the bulls for the next upward swing, potentially retesting the 104.50-105.00 area.

EUR/JPY

Overview
Today last price168.61
Today Daily Change-0.79
Today Daily Change %-0.47
Today daily open169.4
 
Trends
Daily SMA20169.65
Daily SMA50167.42
Daily SMA100164.72
Daily SMA200161.78
 
Levels
Previous Daily High169.59
Previous Daily Low168.66
Previous Weekly High170.89
Previous Weekly Low168.01
Previous Monthly High170.8
Previous Monthly Low164.02
Daily Fibonacci 38.2%169.23
Daily Fibonacci 61.8%169.02
Daily Pivot Point S1168.85
Daily Pivot Point S2168.29
Daily Pivot Point S3167.92
Daily Pivot Point R1169.77
Daily Pivot Point R2170.14
Daily Pivot Point R3170.7

Author

Patricio Martín

Patricio is an economist from Argentina passionate about global finance and understanding the daily movements of the markets.

More from Patricio Martín
Share:

Markets move fast. We move first.

Orange Juice Newsletter brings you expert driven insights - not headlines. Every day on your inbox.

By subscribing you agree to our Terms and conditions.

Editor's Picks

EUR/USD moves sideways below 1.1800 on Christmas Eve

EUR/USD struggles to find direction and trades in a narrow channel below 1.1800 after posting gains for two consecutive days. Bond and stock markets in the US will open at the usual time and close early on Christmas Eve, allowing the trading action to remain subdued. 

GBP/USD keeps range around 1.3500 amid quiet markets

GBP/USD keeps its range trade intact at around 1.3500 on Wednesday. The Pound Sterling holds the upper hand over the US Dollar amid pre-Christmas light trading as traders move to the sidelines heading into the holiday season. 

Gold retreats from record highs, trades below $4,500

Gold retreats after setting a new record-high above $4,520 earlier in the day and trades in a tight range below $4,500 as trading volumes thin out ahead of the Christmas break. The US Dollar selling bias remains unabated on the back of dovish Fed expectations, which continues to act as a tailwind for the bullion amid persistent geopolitical risks.

Bitcoin slips below $87,000 as ETF outflows intensify, whale participation declines

Bitcoin price continues to trade around $86,770 on Wednesday, after failing to break above the $90,000 resistance. US-listed spot ETFs record an outflow of $188.64 million on Tuesday, marking the fourth consecutive day of withdrawals.

Economic outlook 2026-2027 in advanced countries: Solidity test

After a year marked by global economic resilience and ending on a note of optimism, 2026 looks promising and could be a year of solid economic performance. In our baseline scenario, we expect most of the supportive factors at work in 2025 to continue to play a role in 2026.

Avalanche struggles near $12 as Grayscale files updated form for ETF

Avalanche trades close to $12 by press time on Wednesday, extending the nearly 2% drop from the previous day. Grayscale filed an updated form to convert its Avalanche-focused Trust into an ETF with the US Securities and Exchange Commission.