|

AUD/JPY Price Analysis: Bulls maintain a positive stride, potential shift remains possible

  • Daily chart indicators depict a steady buying traction with RSI deep in positive area , but nearing overbought conditions.
  • On the hourly chart indicators are beginning to flatten, which suggests the cross may face some losses ahead of the Asian session.
  • Given the heightened momentum, the stage could be set for a shift in market dominance, suggesting a potential correction on the horizon.

In Monday's session, the AUD/JPY pair managed to acquire supplementary momentum and saw some gains. Despite the strength of the buying momentum, the market may be heading for a correction since the Relative Strength Index (RSI) and Moving Average Convergence Divergence (MACD) hint at overbought levels. Ahead of the Asian session, with the pair nearing cyclical peaks, an incoming pullback for the cross may be on the horizon.

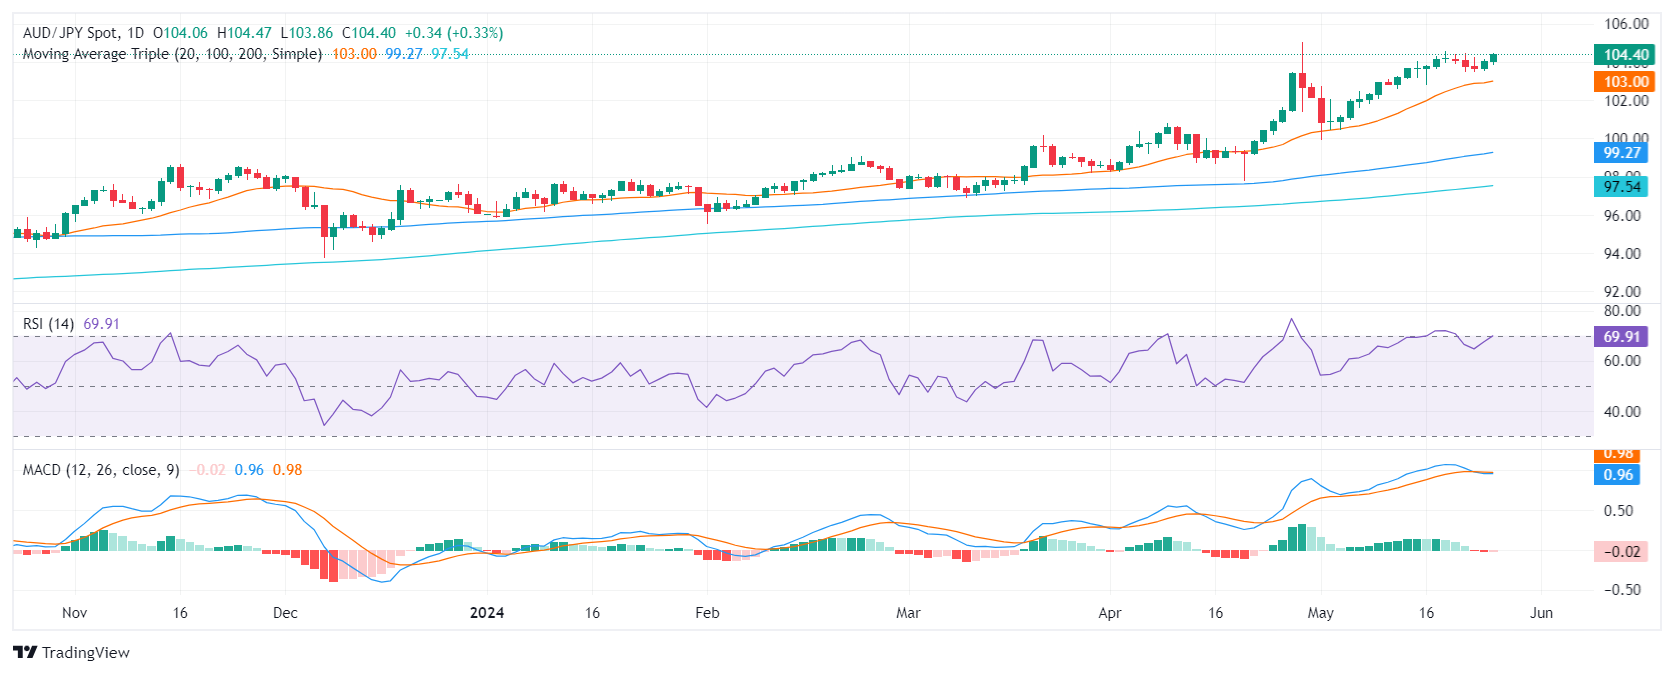
Examining the daily chart, the RSI is near the overbought territory. A gradual decrease from overbought conditions is evident while maintaining a positive trend, indicating buyers' dominance but hinting at a potential flattening. In line with that, the MACD shows a negative momentum as red bars are seen.

AUD/JPY daily chart

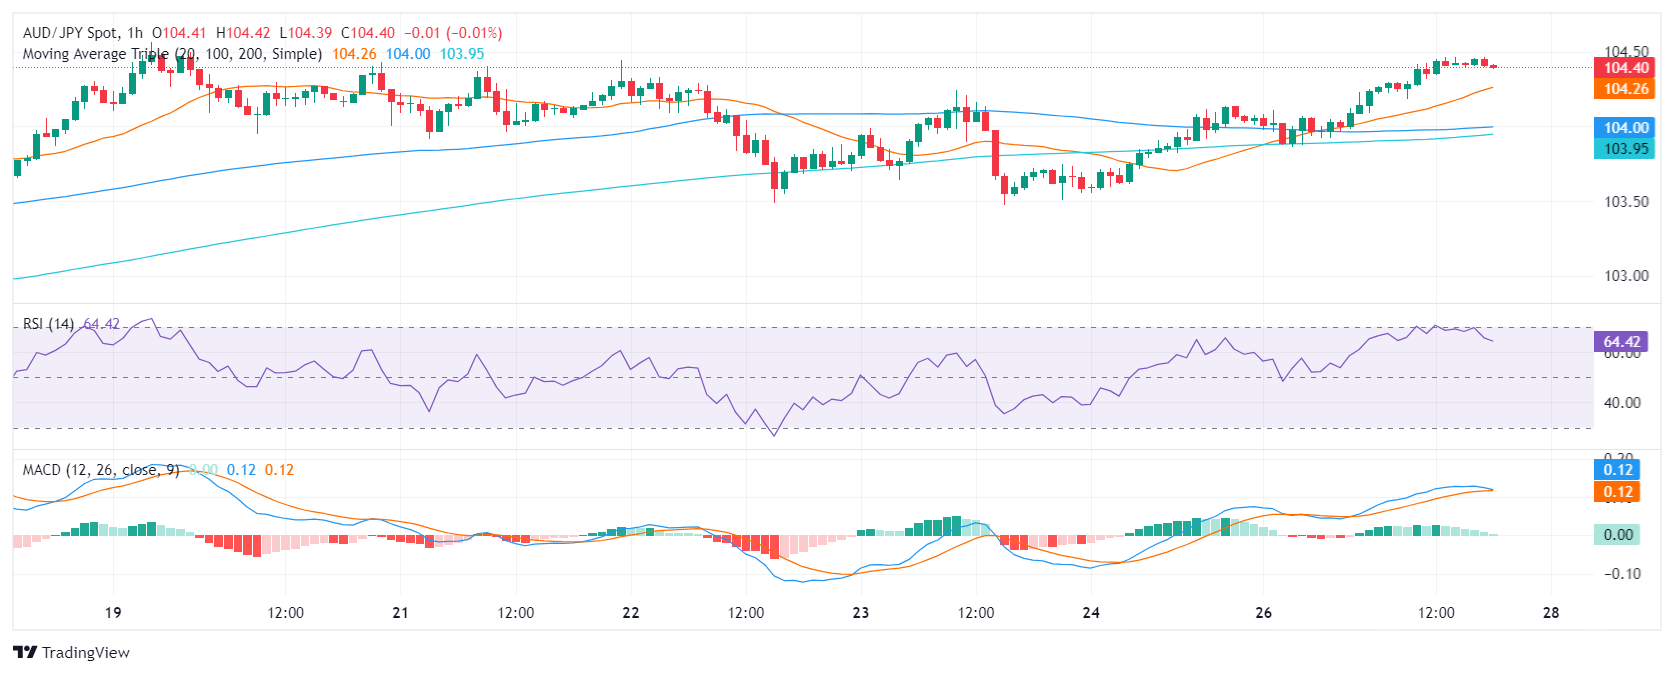
The hourly RSI values reveal a similar positive trend, with values hovering around the 60 mark but pointing downwards. This is backed by the MACD which prints decreasing green bars.

AUD/JPY hourly chart

In the broader context, the AUD/JPY is trading above all three key Simple Moving Average (SMA) benchmarks of 20, 100, and 200 days and this alignment suggests a strong bullish outlook for the pair. However, as the pair remains near cycle highs and due to the cross momentum becoming overextended, a correction could be imminent.

AUD/JPY

Overview
Today last price104.4
Today Daily Change0.34
Today Daily Change %0.33
Today daily open104.06
 
Trends
Daily SMA20102.91
Daily SMA50100.9
Daily SMA10099.19
Daily SMA20097.49
 
Levels
Previous Daily High104.14
Previous Daily Low103.5
Previous Weekly High104.56
Previous Weekly Low103.48
Previous Monthly High105.04
Previous Monthly Low97.78
Daily Fibonacci 38.2%103.9
Daily Fibonacci 61.8%103.75
Daily Pivot Point S1103.66
Daily Pivot Point S2103.27
Daily Pivot Point S3103.03
Daily Pivot Point R1104.29
Daily Pivot Point R2104.53
Daily Pivot Point R3104.93

Author

Patricio Martín

Patricio is an economist from Argentina passionate about global finance and understanding the daily movements of the markets.

More from Patricio Martín
Share:

Editor's Picks

AUD/USD falls to near 0.7100 after slipping below 50-day EMA

AUD/USD depreciates after registering minor gains in the previous day, trading around 0.7120 during the Asian hours. The technical analysis of the daily chart shows the pair consolidating sideways within a rectangle pattern, as neither bulls nor bears gain control. The AUD/USD pair is holding a slight bearish tone however as it sits beneath both the nine-day and 50-day EMAs.

160.00: USD/JPY back near intervention territory after upbeat US jobs report

US Nonfarm Payrolls beat expectations by a wide margin in May, with 172K jobs added. The US Dollar rebounds after the release, helping USD/JPY recover from its intraday lows. Warnings from Japanese authorities continue to limit upside potential near the 160.00 threshold.

Gold targets $4,300 amid stronger Dollar

Gold faces increasing selling interest and navigates the area of three-month lows near the $4,300 mark per troy ounce on Friday. The precious metal’s decline comes as traders assess the stronger-than-expected NFP, while the bid bias in the Greenback and higher US Treasury yields also collaborate with the retracement.

Cardano hits five-year low even as Hoskinson clarifies "break" isn't an exit

Cardano (ADA) price is down 10% at press time on Friday, extending losses over 30% so far this week amid Charles Hoskinson's clarification that "break" isn't an exit.

Week ahead – Fed countdown begins amid US inflation data and geopolitical risks

Fed Chair Warsh’s first meeting approaches as key US inflation data could reshape expectations. Oil prices remain elevated as US-Iran talks continue; tariffs also return to the spotlight. ECB is expected to hike; will it be a one-off move or is July live?

The US economy defies the rules: 100 days into the Oil shock and the recession signal is still missing

More than three months after the start of the Iran war and the resulting disruption to global energy markets, the US economy continues to display remarkable resilience. The conflict has triggered a sharp rise in Oil prices, reignited inflationary pressures and fueled widespread concerns about a potential economic slowdown.